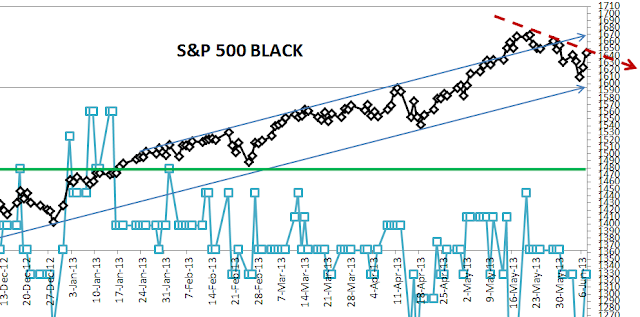
The S&P 500 has bounced to its upper descending
trend-line (shown RED below), if we are indeed in a descending trend. Further upward movement from here will show
that the S&P is not in a down trend.
We’ll have to wait for Monday, but a positive close might
indicate an end to this phase of the correction and drag out the topping
process further. The S&P 500 is
still 9.9% above its 200-day, moving average so any movement upward is not
likely to be long lived. The odds favor that we go
down from here…but we’ll see.
(The BLUE graph with square data points is the daily
output of the NTSM analysis.)
