“Excluding volatile food and fuel, the so-called core measure rose 0.2 percent for a third straight month... The core CPI measure increased 2 percent from November last year, the most since May 2014, after rising 1.9 percent in the prior 12-month period.” Story at…
http://www.bloomberg.com/news/articles/2015-12-15/consumer-price-index-in-u-s-was-unchanged-as-energy-costs-fell
EMPIRE MANUFACTURING (Seeking Alpha)
“…economists were forecasting the headline index to come in at a level of -6.0, but the actual reading came in a bit weaker at -10.7. This represents the fourth straight month that the headline index was below -10, which hasn't happened since the last recession when it stayed below that level for seven months.” Story at….
http://seekingalpha.com/article/3690676-empire-manufacturing-weaker-than-expected-again
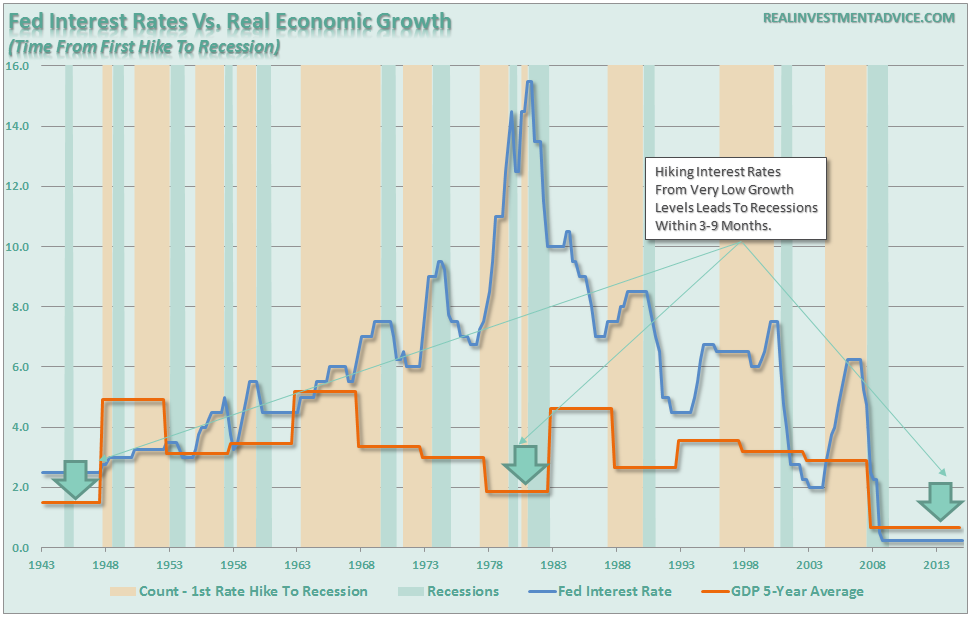
THE FATE OF THE UNIVERSE (Real Investment Advice)
Ok. It’s a bit melodramatic, but here’s a chart and link to the piece…
“This week, the Fed will meet to decide the ‘fate of the universe,’ as they are highly anticipated to announce the first rate hike in a decade.”
 Chart and commentary at…
http://realinvestmentadvice.com/wp-content/uploads/2015/12/Fed-Rates-Vs-GDP-121415.png
RIP YOUR FACE OFF RALLY COMING (CNBC)
“Raymond James strategist Jeffrey Saut said Tuesday stock investors should get ready for a ‘rip your face off-type rally.’ ‘You've got massively oversold conditions in the equity markets, the firm's chief investment strategist told CNBC's "Squawk Box." He said stocks could reach new highs by year-end: ‘The setup is pretty good for a rally to the upside that's going to surprise a lot of people.’" Story/video at…
http://www.cnbc.com/2015/12/15/stocks-ready-for-rip-your-face-off-rally-saut.html
Not everyone is bearish. There have been improvements in the Internals so this isn’t out or the realm of possibility.
MARKET REPORT / ANALYSIS
-Tuesday, the S&P 500 was up about 1.1% to 2043 at the close.
-VIX fell about 8% to 20.95.
-The yield on the 10-year Treasury rose to 2.27.
While the evidence suggests we have seen the top, as I wrote yesterday, there are no guarantees. When the markets enter a true point-of-no-return, bear-market, there should be multiple down-days where almost all of the volume on those days is down. We had one of those days about 3-weeks ago that met the criteria and if the bear market has started, there should be another high-volume down day within 30-days or so. So far there has been no repeat. Further, rather than a repeat to the downside, Tuesday there was a big up-volume day that suggests possible upside. Another high up-volume day Wednesday would be an indication that the markets can get back to prior highs.
Other short term indicators have not improved sufficiently to suggest upside, at least not as of Tuesday, but there are some good signs: the Advance/Decline ratio is still oversold; that’s 5-days in a row and RSI was a whisker from “oversold” at Monday’s low of 1994. There were improvements in the internals too, so they may be headed in the right direction.
As I have noted previously, my current position of 0% in the stock market is too low. It is better to hedge a bit and leave some in the market if I am wrong – a very real possibility! Perhaps I’ll bump investments up on Wednesday – it depends on the data.
MARKET INTERNALS (NYSE DATA)
(I am getting data from a new site. Some of their numbers are subject to minor revision later today so the previous day’s numbers may be slightly different than reported previously. Yahoo Finance’s afternoon numbers are corrupt again today.)
The 10-day moving average of the percentage of stocks advancing (NYSE) rose to 35.1% Tuesday vs. 34.4% Monday. (A number below 50% is usually BAD news for the markets. On a longer term, the 150-day moving average of advancing stocks rose to 48.7%. A value below 50% indicates a down trend.
The McClellan Oscillator (a Breadth measure) remained negative Tuesday, but it improved substantially.
New-lows outpaced New-highs Tuesday. The spread (new-highs minus new-lows) was minus-150. (It was -609 Monday.) The 10-day moving average of the change in spread was -20 Tuesday. In other words, over the last 10-days, on average; the spread has decreased by 20 each day. Market Internals improved to neutral due to increasing up-volume last Thursday and remain neutral Tuesday.

Market Internals are a decent trend-following analysis of
current market action, but should not be used alone for short term trading.
They are usually right, but they are often late. They are most useful when they diverge from
the Index. In 2014, using these
internals alone would have made a 9% return vs. 13% for the S&P 500 (in on
Positive, out on Negative – no shorting).
Of course, few trend-following systems will do well in an extreme
low-volatility, nearly straight-up year like 2014.
NTSM
Tuesday, the NTSM long term indicator was HOLD. The Price indicator is positive. Sentiment is neutral; VIX & Volume are negative. This long-term indicator would now be Sell, but with the market internals improving there is no point in a sell now.

This indicator was SELL previously so a sell now would be
relatively meaningless; that explains my invested position.
MY INVESTED STOCK POSITION:
TSP (RETIREMENT ACCOUNT – GOV EMPLOYEES) ALLOCATION
All cash: G-Fund (Cash, risk-free yielding 2.1% over the last 12-months): 100%
I made a rather impulsive sell decision. For my reasons (or lack of reason) see “My Invested Stock Position” in my prior blog at...
http://navigatethestockmarket.blogspot.com/2015/11/factset-earnings-cass-freight-index.html
There have been enough major top indicators recently to warrant more caution than usual. If we see an improvement in internals, I will increase my invested %.
One needn’t be “all-out” to be well protected if there is a bear market. In fact, I don’t recommend it. For example: With 30% invested in the stock market, one would only lose 15% of the portfolio if the market were to be cut in half; one would have plenty to invest at the bottom and 30% in stocks hedges the bet if the markets go up.