“U.S. crude stockpiles rose by 2.8 million barrels in the
week through Jan. 20, matching analysts expectations and roughly in line with
an earlier report from the American Petroleum Institute…‘It was a very bearish
report, and it's a cloud over this market, but it's no asset class left behind
at the moment,’ Kilduff [John Kilduff, Capital founding partner] said.” Story
at...
RICHMOND FED (Richmond FED)
“Fifth District manufacturing activity strengthened in
January, with continued growth in new shipments and the volume of new orders.
Employment picked up, although increases in average manufacturing wages were
less widespread than in December. The average workweek continued to grow, but
increases were less prevalent in January than a month earlier. Growth in input
prices moderated, while growth in prices of finished goods accelerated. Expectations
for shipments in the next six months were upbeat, and survey participants'
outlook for the volume of new orders continued to be optimistic…” – Richmond
FED. For charts and analysis see…
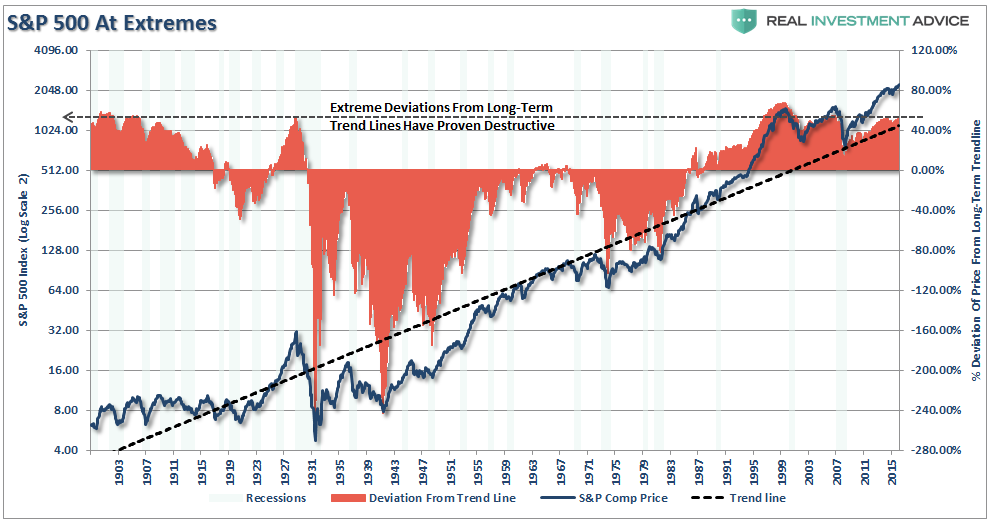
S&P 500 AT EXTREMES (RIA)
(This commentary was titled, “Technically
Speaking: The Immediacy Trap” at the Real Investment Advice
website.)
“Currently, while only slightly below the peak of the
2000 “dot.com” bubble, the deviation [from the long-term trend-line] is at
levels that have ALWAYS coincided with a negative mean reverting event or very
poor, and highly volatile, forward returns.” – Lance Roberts. Commentary at…
MARKET REPORT / ANALYSIS
-Wednesday the S&P 500 rose about 0.8% to 2298.
-VIX dropped about 6% to 10.81.
(VIX hasn’t been this low since July of 2014. The lack of fear is making me
afraid.)
-The yield on the 10-year Treasury rose to 2.514%.
Today was another statistically significant up-day (based
on statistical analysis of market volatility) and that is followed by a
down-day about 62% of the time. Further, this is the sixth
statistically-significant day in the last 16-trading sessions; but only one of
those days has been down. This stat is
looking more bullish, but other indicators are suggesting down, and really, so
does this one.
Closing Tick (a sum of last trades of the day) was a high
326. “300” is considered a sell point by
Tom McClellan. A number of other indicators remain pointing down too.
Bollinger Bands are indicating “overbought” since the
S&P 500 Index now exceeds the upper Bollinger Band. That’s more than a
2-std-deviation move above the mean and it usually results in at least a 3%
pullback. With the number of other
indicators showing stretched conditions one would expect a slightly higher
pullback. Of course there is a possibility of a >10% correction, however; so
far, there is little news to set it off. On the other hand, we see that there
has been strong up-trend late in the day the last couple of days so perhaps
this rally still has legs? We’ll see…
It seems to me that if President Trump were to implement
his “build it in America and tax the foreigners like they tax us” policies
overnight, it would be inflationary since the cost of goods must go up. This
would benefit the middle class and poor, thru more jobs, and hurt the
upper-classes. The upper class would be hurt with higher prices and reduced
stock values associated with inflationary conditions. He is talking about going
after the Drug industry, too. At this point, the market doesn’t care much so my
musings are meaningless in the short-run. (The exceptions are Biotech and
Pharma and they are about the only sectors to fall this week, but even they
were up today.) I will say this about Trump though; he is the most unique
President in recent memory.
I am beginning to sound like a broken record on the
market: Short-term indicators continue to show that the market is stretched; I
think the upside potential is limited while the downside risk remains fairly
high, at least for a short-term pullback. I remain a short-term bear and a
long-term bull.
CURRENT RANKING OF 11 ETFs (Ranked Daily)*
#1 RANK for the past 55-days: Financial Select Sector
SPDR ETF (XLF).
Here’s today’s complete result of the ETF Ranking.

I would avoid IBB and XLV; currently their 120-dMAs are
declining.
*For background on the ETF ranking system see NTSM Page
at…
TRADING PORTFOLIO - 2017 (Small-% of the total portfolio)
Rydex 2x Short S&P 500 (RYTPX): Established 6 Dec.
2x Short S&P 500 (SDS): Established 16 Dec.
Long Volatility ETN (VXX): Established 6 Jan 2017.
NET:
Now I wish I had tightened trading rules sooner. I am
underwater again!
WEDNESDAY MARKET INTERNALS (NYSE DATA)
-10-day moving average of the percentage of stocks
advancing (NYSE): 55.3%. (55.3% prior trading-day.) A number above 50% is
usually BULLISH for the markets short-term.
-150-day moving average of advancing stocks: 52.8%. (A
value above 50% indicates a long-term, up-trend.)
-McClellan Oscillator: Rose from +48 to +74 (percentage
calculation method adjusted to fit McClellan’s values).
-New-highs minus new-lows: +123
(It was +128 prior trading day.)
-10-day moving average of the change in spread: +24. In other
words, over the last 10-days, on average, the spread has increased by 24 each
day.
Market Internals remained
Positive on the market.

Market Internals are a decent trend-following analysis of
current market action, but should not be used alone for short term trading.
They are usually right, but they are often late. They are most useful when they diverge from
the Index. In 2014, using these
internals alone would have made a 9% return vs. 13% for the S&P 500 (in on
Positive, out on Negative – no shorting).
LONG TERM INDICATOR
Wednesday, the Sentiment, VIX & Volume indicators
were neutral. The Price indicator was positive.

MY INVESTED STOCK POSITION:
TSP (RETIREMENT ACCOUNT – GOV EMPLOYEES) ALLOCATION
I increased stock allocation to 50% stocks in
the S&P 500 Index fund (C-Fund) Friday, 23 Sep 2016 in my long-term
accounts.
Remainder is 50% G-Fund. This is a conservative retiree allocation.