“Throughout U.S. history, every 'giant financial bubble'
has always ended very badly, and this time around will not be an exception.
Trump may get the blame for it when it bursts, but the truth is that the
conditions for the coming crisis have been building for a very, very long time.
I expect the stock market to stall out mid-way this year in June/July at which
point things could turn south.” – Chris Vermeulen. Commentary at…
SAVING RETIREMENT (Raymond James)
“…it is still
early in the [earnings] season…There has also been double the amount of
positive guidance issued than negative guidance, which is a favorable departure
from the last few quarters where negative guidance dominated, and this trend
will hopefully continue…but we continue to believe stocks may have limited
upside without some sort of pullback first. Therefore, remain careful and
cautious and don’t forget to save for retirement!” – Jeffery Saut.
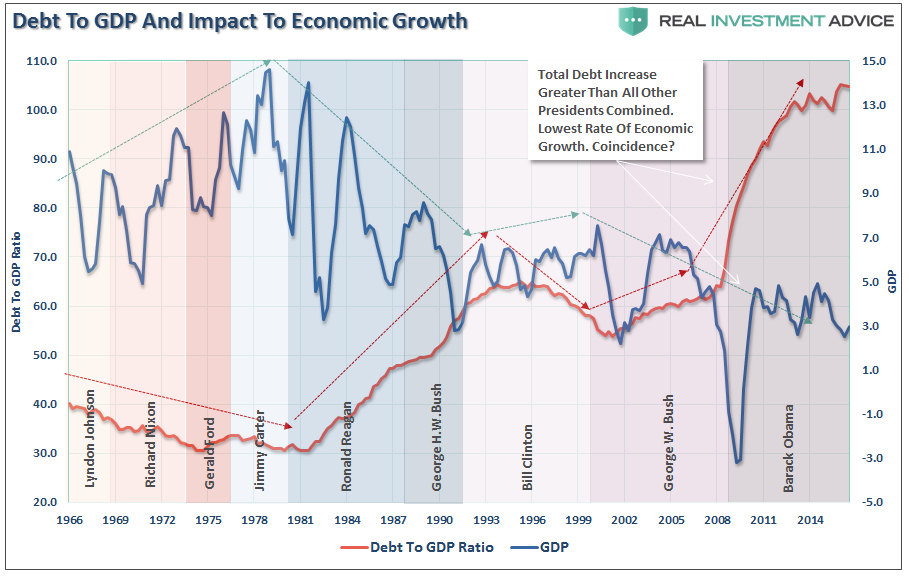
DEBT TO GDP RATIO (weekend Reading from Real Investment
Advice)
 Chart from Real Investment Advice at…
My cmt: The chart
above shows “annual growth” in GDP
(in Blue) not GDP as indicated on the chart.
(GDP has grown every year since 1966 except for the Housing Crisis
recession where it went negative.) One might conclude from the chart that there
is an inverse relationship between GDP-growth and debt. Higher debt drives
lower growth, at least that’s one theory and it’s implied by the chart’s title. I must point out that the cause and effect might
be reversed. Perhaps, falling GDP-growth
drives Governments to spend more. That’s certainly where Obama went before and
where Trump is headed now. The sad fact is that the added spending (expressed
as Debt to GDP ratio) has not stemmed the 40-year slide in GDP-growth; but that
won’t stop the politicians from trying and continuing to waste our taxes.
MARKET REPORT / ANALYSIS
-Monday the S&P 500 slipped about 0.3% to 2271.
-VIX rose about 2.5% to 12.88.
-The yield on the 10-year Treasury slipped to 2.404%.
There isn’t much change to indicators at this point.
There not much positive. New-high/new-lo data is looking negative and a plot of
new-highs continues to fall on a smoothed basis. Money Trend is sharply down and a plot of
16-Indicators also remains sharply down. Overall, the market is stretched and
may continue to stretch higher, but I think the upside potential is limited
while the downside risk is fairly high, at least for a short-term pullback. I
remain a short-term bear.
CURRENT RANKING OF 11 ETFs (Ranked Daily)*
#1 RANK for the past 53-days: Financial Select Sector
SPDR ETF (XLF).
#2 RANK: iShares Russell 2000 – Small Cap ETF (IWM)
#3 RANK: Industrial Select Sector SPDR ETF (XLI)
Here’s today’s complete result of the ETF Ranking.
 *For background on the ETF ranking system see NTSM Page
at…
*For background on the ETF ranking system see NTSM Page
at…
TRADING PORTFOLIO - 2017 (Small-% of the total portfolio)
Rydex 2x Short S&P 500 (RYTPX): Established 6 Dec.
2x Short S&P 500 (SDS): Established 16 Dec.
Long Volatility ETN (VXX): Established 6 Jan 2017.
NET:
The S&P 500 is now up about 2.4% since my initial
short position taken on 6 December. I
have tightened short-term trading criterion since then and refined short-term
signals to take an ensemble approach. I am forced to admit that there is no one
magic indicator.
MONDAY MARKET INTERNALS (NYSE DATA)
-10-day moving average of the percentage of stocks
advancing (NYSE): 51.5%. (50.7% prior trading-day.) A number above 50% is
usually BULLISH for the markets short-term.
-150-day moving average of advancing stocks: 52.8%. (A
value above 50% indicates a long-term, up-trend.)
-McClellan Oscillator: Rose from --25 to -18 (percentage
calculation method adjusted to fit McClellan’s values).
-New-highs minus new-lows: +69
(It was +72 prior trading day.)
-10-day moving average of the change in spread: -3. In
other words, over the last 10-days, on average, the spread has decreased by 3
each day.
Market Internals remained
Neutral on the market.

Market Internals are a decent trend-following analysis of
current market action, but should not be used alone for short term trading.
They are usually right, but they are often late. They are most useful when they diverge from
the Index. In 2014, using these
internals alone would have made a 9% return vs. 13% for the S&P 500 (in on
Positive, out on Negative – no shorting).
LONG TERM INDICATOR
Monday, the Sentiment, VIX & Volume indicators were
neutral. The Price indicator was positive.

MY INVESTED STOCK POSITION:
TSP (RETIREMENT ACCOUNT – GOV EMPLOYEES) ALLOCATION
I increased stock allocation to 50% stocks in
the S&P 500 Index fund (C-Fund) Friday, 23 Sep 2016 in my long-term
accounts.
Remainder is 50% G-Fund. This is a conservative retiree allocation.