RETAIL SALES (Reuters)
“U.S. retail sales increased by the most in 1-1/2 years
in March as households boosted purchases of motor vehicles and a range of other
goods, the latest indication that economic growth picked up in the first
quarter after a false start.” Story at…
JOBLESS CLAIMS (MarketWatch)
"The number of people who applied for unemployment benefits in mid-April fell for the fifth week in a row to a nearly 50-year low of 192,000, a remarkably small level of layoffs that gives the economy a sturdy foundation on which it can grow despite recent hiccups."
Story at…
PHILADELPHIA FED (Kitco.com)
“The
headline current general activity index for a survey of manufacturers in the
Philadelphia area slid to 8.5 in April from 13.7 in March, the regional Federal
Reserve bank said Thursday.” Story at…
The
news wasn’t all bad; new orders improved. The value above zero for the headline
number still indicates expansion, albeit, at a slower rate.
LEI (Conference Board/prnewswire)
“The Conference Board Leading Economic
Index® (LEI) for the U.S. increased 0.4 percent in March to
111.9 (2016 = 100), following a 0.1 percent increase in February, and no change
in January…"Despite the relatively large gain in March, the trend in the
US LEI continues to moderate, suggesting that growth in the US economy is
likely to decelerate toward its long-term potential of about 2 percent by year
end." - Ataman Ozyildirim, Director of Economic Research at The Conference
Board. Press release at…
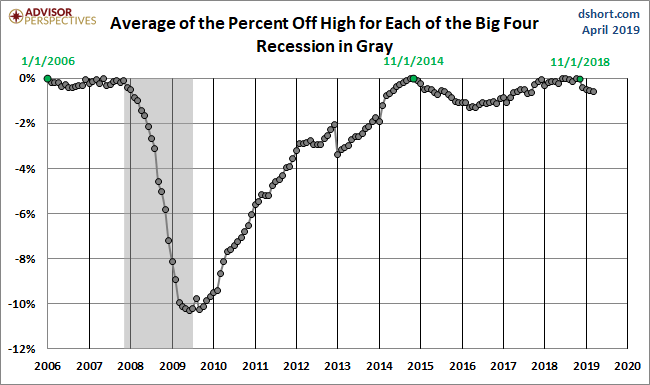
THE BIG FOUR ECONOMIC INDICATORS (Advisor Perspectives)
“There is…a general belief that there are four big
indicators that the [NBER] committee weighs heavily in their [recession] cycle
identification process. They are: Nonfarm Employment; Industrial Production;
Real Retail Sales; and Real Personal Income (excluding Transfer Receipts)…Here
is a percent-off-high chart based on an average of the Big Four.” – Jill
Mislinski.

More charts and discussion at…
MARKET REPORT / ANALYSIS
-Thursday the S&P 500 rose about 0.2% to 2905.
-VIX dropped about 4% to 12.09.
-The yield on the 10-year Treasury dipped to 2.563%.
There aren’t too many bullish signs. The biggest is that
the cyclical industrial stocks (XLI-ETF) are outperforming the S&P 500
index. If investors were worried about recession, cyclicals would be
underperforming the Index. A lot of signs seem neutral. There are a few bear signs though.
Today we saw a bearish crossover of the MACD (12/26/9,
EMA’s). The slope of the MACD line is also negative. The last time it happened
there was only a small slip in the market, so it’s hard to get too worked up. MACD
is followed by many traders, so this could cause some worry. There are other
bearish indicators, too: My Money Trend indicator is falling; New-high/new-low
data looks bearish; The size of up-moves has been falling relative to down
moves.
The overbought/oversold ratio remained neutral and RSI
was also neutral.
My daily sum of 20 Indicators slipped from -2 to -4 (a
positive number is bullish; negatives are bearish) while the 10-day smoothed
version that negates the daily fluctuations dropped from +16 to +6. Most of
these indicators are short-term.
I am bullish now, but still looking for a better entry
point. I expect the market direction to be down (overall) for a bit. Mr. Market
has not agreed with me, although the S&P 500 has been flat for a week.
We’ll see.
TOP / BOTTOM INDICATOR SCALE OF 1 TO 10
Today’s Reading: 0
Most Recent Day with a value other than Zero: -1 on 17
April (RSI was negative.)
(1) +10 Max Bullish / -10 Max Bearish)
(2) -4 or below is a Sell sign. +4 or better is a Buy
Sign.
MOMENTUM ANALYSIS:
TODAY’S RANKING OF
15 ETFs (Ranked Daily)

The top ranked ETF receives 100%. The rest are then
ranked based on their momentum relative to the leading ETF. While momentum isn’t stock performance per
se, momentum is closely related to stock performance. For example, over the 4-months
from Oct thru mid-February 2016, the number 1 ranked Financials (XLF)
outperformed the S&P 500 by nearly 20%. In 2017 Technology (XLK) was ranked
in the top 3 Momentum Plays for 52% of all trading days in 2017 (if I counted
correctly.) XLK was up 35% on the year while the S&P 500 was up 18%.
*For additional background on the ETF ranking system see
NTSM Page at…
TODAY’S RANKING OF THE DOW 30 STOCKS (Ranked Daily)
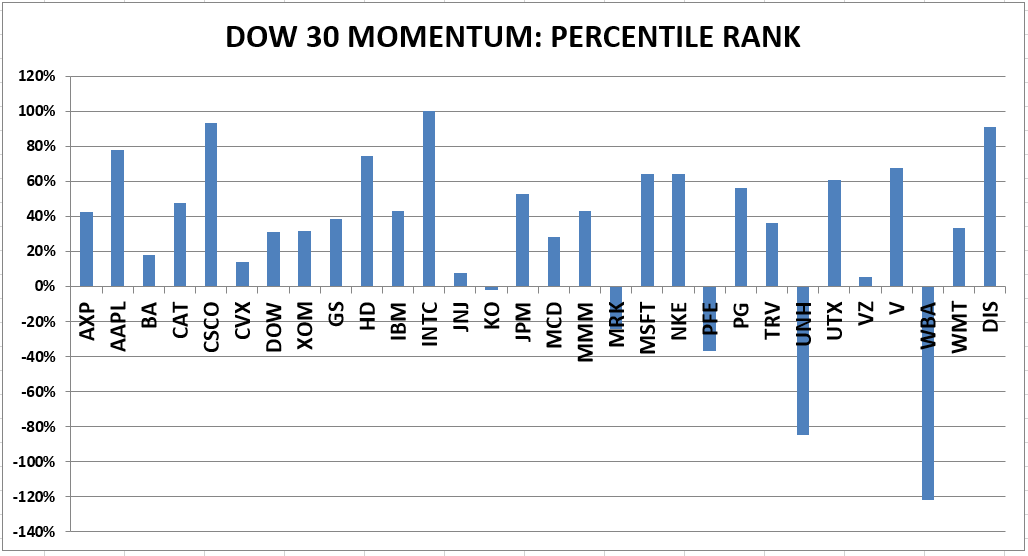
The top ranked stock receives 100%. The rest are then
ranked based on their momentum relative to the leading stock.
*I rank the Dow 30 similarly to the ETF ranking system.
For more details, see NTSM Page at…
THURSDAY MARKET INTERNALS (NYSE DATA)
Market Internals
remained NEUTRAL on the market.
Market Internals are a decent trend-following analysis of
current market action but should not be used alone for short term trading. They
are usually right, but they are often late.
They are most useful when they diverge from the Index. In 2014, using these internals alone would
have made a 9% return vs. 13% for the S&P 500 (in on Positive, out on
Negative – no shorting).
My current stock allocation is about 30% invested in
stocks as of 9 January 2019. I sold the rally about half way up expecting a retest
of the lows Dec 2018.
INTERMEDIATE / LONG-TERM INDICATOR
Thursday, the VIX, VOLUME, PRICE and SENTIMENT indicators
were neutral. Overall this is a NEUTRAL indication.