"This imaginary person out there - Mr. Market - he's
kind of a drunken psycho. Some days he gets very enthused, some days he gets
very depressed. And when he gets really enthused, you sell to him and if he
gets depressed you buy from him. There's no moral taint attached to that."
- Warren
Buffett
“The big money is not in the buying and selling. But in the
waiting.” - Charlie Munger, Vice Chairman, Berkshire Hathaway
HOUSING STARTS / BUILDING PERMITS (MarketWatch)
“Housing starts occurred at a 1.19 million seasonally
adjusted annual rate in June, the Commerce Department said Friday, representing
a 17% increase from May. Permitting activity for newly-built homes rose 2.1%
between May and June…” Story at…
MICHIGAN SENTIMENT (Business Insider)
“The University of Michigan's consumer-sentiment gauge snapped
a two-month uptrend in July, offering an early sign that new coronavirus
outbreaks are reversing the economic recovery. The university's index of
consumer sentiment fell to 73.2 from June's reading of 78.1…” Story at…
CORONAVIRUS (NTSM)
Here’s the latest from the COVID19 Johns Hopkins website
as of 8:30 PM Friday. There were about 89,000 new cases today (another new
record high). The steepening curve is
the graphic indication that new-cases are growing at a dramatically faster rate
than we have seen at any time in the US…and they continue to accelerate.

-Friday the S&P 500 rose about 0.3% to 3225.
-VIX fell about 8% to 25.68.
-The yield on the 10-year Treasury rose to 0.634%.
Here’s the Friday run-down of some important indicators.
BULL SIGNS
-The 50-dMA of stocks
advancing on the NYSE (Breadth) is above 50%.
-100-dMA of Breadth (advancing stocks on the NYSE) closed
above 50% today.
-The Fosback High-Low Logic Index is STILL bullish
and is giving BUY signal. This indicator also gave a BUY signal 2 days after
the 23 March bottom.
-The 5-10-20 Timer System remained BUY, because the
5-dEMA and 10-dMA are above the 20-dEMA.
-Long-term new-high/new-low data is bullish.
-Short-term new-high/new-low data is bullish.
-My Money Trend indicator is now
headed up.
-MACD of S&P 500 price made a bullish crossover
8July.
-Cyclical Industrials (XLI-ETF) are outperforming the
S&P 500 by a lot – a bull sign.
NEUTRAL
-The size of up-moves has been smaller than the size of
down-moves over the last month and we had Bearish sell signs last week; for
now, it remains in neutral territory. It is still closer to a sell-signal than
a Buy-signal, but unless it declines again, the bearish sign is over.
-VIX is Neutral.
-The S&P 500 is neutral relative to its 200-dMA. It
is not too diverging too far above or below it.
-Statistically, the S&P 500 gave a panic-signal, 11
June. A panic signal usually suggests more to come. We did not see big negative follow-thru so
I’ll put this one in the negative category.
-Non-crash Sentiment is neutral. (If the downturn deepens
and becomes more extended, I’ll switch to crash sentiment; that would take a
much lower value to issue a buy-signal.)
-Bollinger Bands are close to giving a bear signal, but remain
neutral. RSI is neutral.
-Overbought/Oversold Index, a measure of advance-decline
data, is neutral.
-Over the last 10 and 20-days, the number of up-days is stretched
(slightly bearish) but it remains neutral for now.
-MACD of stocks advancing on the NYSE (breadth) made a bearish
crossover 11 June, but this indicator is improving and may soon turn bullish.
-The Utilities ETF (XLU) is under-performing the S&P
500, but just barely and it may turn bearish soon if it begins to outperform
the Index. For now, let’s call it Neutral.
-The percentage of 15-ETFs that are above their
respective 120-dMA was 67% Friday. That’s a mid-level number so we’ll just call
it neutral. (This is a new indicator and I don’t have much experience with it
BEAR SIGNS
- The smoothed advancing volume on the NYSE switched to
Bearish today.
- Breadth on the NYSE vs the S&P 500 index has
diverged from the S&P 500 index in a bearish manner. The Index remains way too far ahead of
breadth, at least using moving average comparisons that have usually proved to
be correct. (This indicator has been negative for a while and I’m losing
confidence in it. It called a top on 8 June. It wouldn’t take much for that
high to be surpassed. Then we really have to reconsider the indicator.)
- The Smart Money (late-day action) is bearish. This
indicator is based on the Smart Money Indicator (a variant of the indicator
developed by Don Hayes).
On Friday, 21 February, 2 days after the top of this
pullback, there were 10 bear-signs and 1 bull-sign. Now there are 9 bull-signs and
3 bear-signs. Last week there were 12 bull-signs and 2 bear-signs.
The daily sum of 20 Indicators declined from +5 to
-1 (a positive number is bullish; negatives are bearish). The 10-day smoothed
sum that smooths the daily fluctuations improved from +24 to +27. (These
numbers sometimes change after I post the blog based on data that comes in
late.) Most of these indicators are short-term.
All things considered; I have to be a skeptical Bull due
to strong indicators.
MOMENTUM ANALYSIS:
TODAY’S RANKING OF
15 ETFs (Ranked Daily)
The top ranked ETF receives 100%. The rest are then
ranked based on their momentum relative to the leading ETF.

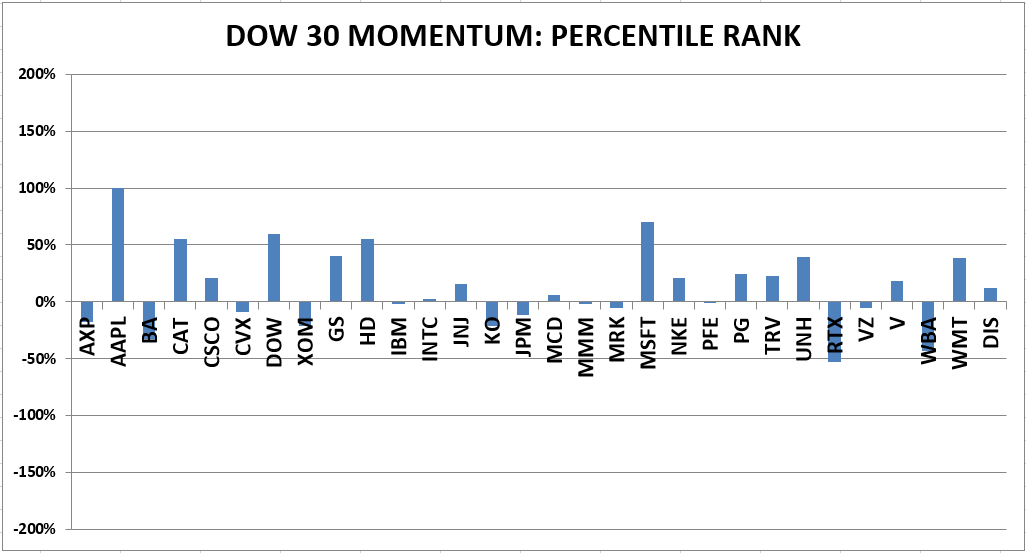
TODAY’S RANKING OF THE DOW 30 STOCKS (Ranked Daily)
The top ranked stock receives 100%. The rest are then
ranked based on their momentum relative to the leading stock.
For more details, see NTSM Page at…
MSFT has been fading recently. I would have sold it, but they report earnings
on Wednesday so I’ll hang on. Here’s a report from Zacks:
“MSFT shares are down around 5% from its recent highs at
the moment, and longer-term investors don’t need to find the best entry points
because it seems reasonable to think that around $200 a share for Microsoft
will appear like a steal a year or two from now. Let’s not forget that
Microsoft’s 1% dividend yield tops the 10-year Treasury’s 0.63%. And Microsoft
is poised to weather nearly any economic storm, as it held over $137 billion in
cash and equivalents at the end of last quarter. The tech powerhouse is also
likely to continue to buy back a ton of stock.” Analysis at…
FRIDAY MARKET INTERNALS (NYSE DATA)
Market Internals remained
NEUTRAL on the market.
Market Internals are a decent trend-following analysis of
current market action, but should not be used alone for short term trading.
They are usually right, but they are often late. They are most useful when they diverge from
the Index. In 2014, using these
internals alone would have made a 9% return vs. 13% for the S&P 500 (in on
Positive, out on Negative – no shorting).
Using the Short-term indicator in 2018 in SPY would have
made a 5% gain instead of a 6% loss for buy-and-hold. The methodology was Buy
on a POSITIVE indication and Sell on a NEGATIVE indication and stay out until
the next POSITIVE indication. The back-test included 13-buys and 13-sells, or a
trade every 2-weeks on average.
My current stock allocation is about 40% invested in
stocks. You may wish to have a higher or lower % invested in stocks depending
on your risk tolerance. 40% is a conservative position that I re-evaluate
daily.
As a retiree, 50% in the stock market is about fully
invested for me – it is a cautious and conservative number. If I feel very
confident, I might go to 60%; had we seen a successful retest of the bottom,
80% would not have been out of the question.