"This imaginary person out there - Mr. Market - he's
kind of a drunken psycho. Some days he gets very enthused, some days he gets
very depressed. And when he gets really enthused, you sell to him and if he
gets depressed you buy from him. There's no moral taint attached to that."
- Warren
Buffett
“The big money is not in the buying and selling. But in the waiting.”
- Charlie Munger, Vice Chairman, Berkshire Hathaway
CASS FREIGHT INDEX (CASS Information Systems)
“The Cass Freight Index showed sequential volume improvement
again in June, although freight volumes still remain well below year-ago levels
and also below pre-pandemic levels. We were thinking the
June rebound would have been stronger, based on what we’re hearing on the
trucking side and what we’ve been seeing with respect to rail traffic and with
the ISM Index now back >50. Earnings season for the transports kicks off
this week, and we should get more color on why this may have been the case. In
our view, U.S. freight volumes (the amount of “stuff” moving around the
country) will not return to 2019 levels until 2021 at the earliest. Given the
most recent Cass readings, there is still a wide gap to bridge.” Press release at…
WELCOME TO THE END GAME (Forbes)
“If this chart doesn’t make you think the crash is coming
soon, then probably nothing will:

The Nasdaq is on its final run and is going vertical, a
classic end of bubble move.” Chart and commentary at…
CORONAVIRUS (NTSM)
Here’s the latest from the COVID19 Johns Hopkins website
as of 5:15 PM Tuesday. There were about 27,000 new cases reported today. The data isn’t always consistent over the
weekend. (Sick people don’t go to the hospital on weekends? Reporting is
different over the weekend? I don’t know.) Today, it looks like the weekend data
showing lower numbers of new cases might have been valid. Note the flattening
of the curve at the top. If this decline in new cases continues, markets will
see this as very good news.

CHART OF DAILY NEW CASES (WSJ)
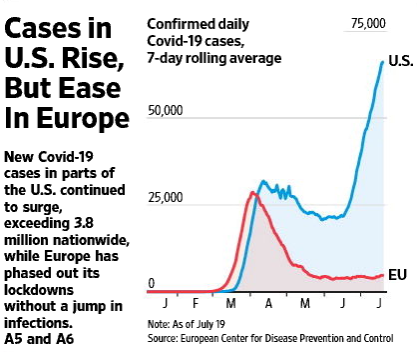
““People in Europe understood what they
need to do. They take it seriously,” says Ilaria Capua, an Italian virologist
at the University of Florida. “The crisis has been handled differently in
different countries, but nobody in Europe is saying this is a nothing crisis…In
the U.S., “we are pushing this idea that we have to live with the virus, that
there’s nothing we can do. That’s not true: Europe shows you can turn the
epidemic around,” said Jennifer Nuzzo, an epidemiologist and senior scholar at
Johns Hopkins Center for Health Security.”
For subscribers of the WSJ, link follows:
My cmt: “…nobody in Europe is saying
this is a nothing crisis.” Here, there are many who continue to believe
that this crisis is manufactured. They have forgotten that China originally ignored
the crisis and chose to do nothing. So many people got sick that it ruined
their economy and they had to lockdown their country anyway.
MARKET REPORT / ANALYSIS
-Tuesday the S&P 500 rose about 0.2% to 3257.
-VIX rose about 0.4% to 24.84.
-The yield on the 10-year Treasury slipped to 0.602%.
We note that the S&P 500 was about 8% above its
200-dMA at today’s high. The Index closed
7.3% above its 200-dMA. 8% is high and a number in the 10-15% range is a clear pullback
signal. Bollinger Bands and RSI are also
elevated. The markets can continue higher, but we’ll keep an eye on these critical
topping indicators.
The daily sum of 20 Indicators improved from zero
to +5 (a positive number is bullish; negatives are bearish). The 10-day
smoothed sum that smooths the daily fluctuations improved from +22 to +29.
(These numbers sometimes change after I post the blog based on data that comes
in late.) Most of these indicators are short-term.
All things considered; I have to be a skeptical Bull
until proven otherwise. There is still room for the Index to run higher;
however, we are getting closer to a pullback of some kind.
MOMENTUM ANALYSIS:
TODAY’S RANKING OF
15 ETFs (Ranked Daily)
The top ranked ETF receives 100%. The rest are then
ranked based on their momentum relative to the leading ETF.

*For additional background on the ETF ranking system see
NTSM Page at…
TODAY’S RANKING OF THE DOW 30 STOCKS (Ranked Daily)
The top ranked stock receives 100%. The rest are then
ranked based on their momentum relative to the leading stock.

For more details, see NTSM Page at…
TUESDAY MARKET INTERNALS (NYSE DATA)
Market Internals
remained NEUTRAL on the market.
Market Internals are a decent trend-following analysis of
current market action, but should not be used alone for short term trading.
They are usually right, but they are often late. They are most useful when they diverge from
the Index. In 2014, using these
internals alone would have made a 9% return vs. 13% for the S&P 500 (in on
Positive, out on Negative – no shorting).
Using the Short-term indicator in 2018 in SPY would have
made a 5% gain instead of a 6% loss for buy-and-hold. The methodology was Buy
on a POSITIVE indication and Sell on a NEGATIVE indication and stay out until
the next POSITIVE indication. The back-test included 13-buys and 13-sells, or a
trade every 2-weeks on average.
My current stock allocation is about 40% invested in
stocks. You may wish to have a higher or lower % invested in stocks depending
on your risk tolerance. 40% is a conservative position that I re-evaluate
daily. It is not far below my fully invested position which would be between
50-60%.
As a retiree, 50% in the stock market is about fully
invested for me – it is a cautious and conservative number. If I feel very
confident, I might go to 60%; had we seen a successful retest of the bottom,
80% would not have been out of the question.