"This imaginary person out there - Mr. Market - he's
kind of a drunken psycho. Some days he gets very enthused, some days he gets
very depressed. And when he gets really enthused, you sell to him and if he
gets depressed you buy from him. There's no moral taint attached to that."
- Warren
Buffett
“The big money is not in the buying and selling. But in the
waiting.” - Charlie Munger, Vice Chairman, Berkshire Hathaway
JOBLESS CLAIMS (CNN Business)
“In yet another sign that the economic recovery is teetering in a resurgence of coronavirus
cases, the number of Americans filing first-time unemployment claims rose for
the second week in a row. Some 1.4 million people filed for initial jobless claims last week, up 12,000 from the prior
week's revised level, which was the first increase in 16 weeks…” Story at…
GDP-ADV (CNBC)
“The U.S. economy saw the biggest quarterly plunge in
activity ever, though the plummet in the second quarter wasn’t as bad as
feared. Gross domestic product from April to June plunged 32.9% on an
annualized basis, according to the Commerce Department’s first reading on the
data released Thursday.” Story at…
MARKETS SENDING CONFOUNDING MESSAGES (Real Investment Advice)
“The fog of the Fed is rendering most traditional
economic signs meaningless. Gauges to help manage risk are obscured and
disfigured. Even more confusing, some signals are contradictory to each
other. Just as drivers occasionally get caught in a thick fog, investors must
navigate today’s markets differently than when the sun is shining.
Investors need to modify their behavior to exercise more caution.” Commentary at…
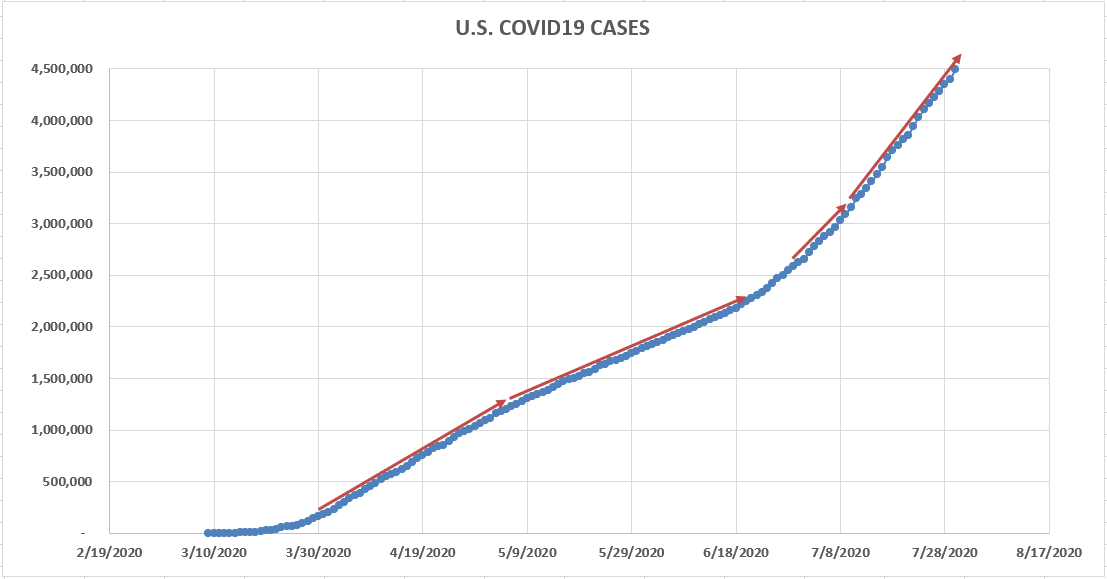
CORONAVIRUS (NTSM)
Here’s the latest from the COVID19 Johns Hopkins website
as of 10:20 PM Thursday. The US had about 95,000 new cases today. This is a new
record, but it is partly because I got the data late. The curve of total US
cases is still climbing steeply.
-Thursday the S&P 500 dipped about 0.4% to 3246.
-VIX rose about 3% to 24.76.
-The yield on the 10-year Treasury slipped to 0.536%.
Lazy reporters are telling us that today’s drop was
caused by bad US-GDP numbers. No, it wasn't.
The futures were way down at 3AM more than 5 hours before the GDP data
was released. The weakness might have been the result of poor numbers from
Europe over night. Volkswagen cut their dividends on a near 30% drop in sales.
The German DAX fell sharply, down almost 4% late in trading; but who knows.
Guessing the cause of market action is often a pointless exercise, except when
the Fed makes a move.
I had a computing error in the Indicator Sum yesterday.
That has been corrected. Today, the daily sum of 20 Indicators declined from -5
to -4 (a positive number is bullish; negatives are bearish). The 10-day
smoothed sum that smooths the daily fluctuations declined from +7 to -3.
(These numbers sometimes change after I post the blog based on data that comes
in late.) Most of these indicators are short-term.
It sure feels like we are near a top; however, I don’t
see major divergences in the internals.
Top Indicators are silent. It looks like the markets can go higher.
MOMENTUM ANALYSIS:
TODAY’S RANKING OF
15 ETFs (Ranked Daily)
The top ranked ETF receives 100%. The rest are then
ranked based on their momentum relative to the leading ETF.

TODAY’S RANKING OF THE DOW 30 STOCKS (Ranked Daily)
The top ranked stock receives 100%. The rest are then
ranked based on their momentum relative to the leading stock.

For more details, see NTSM Page at…
THURSDAY MARKET INTERNALS (NYSE DATA)
Market Internals remained
NEUTRAL on the market.
Market Internals are a decent trend-following analysis of
current market action, but should not be used alone for short term trading.
They are usually right, but they are often late. They are most useful when they diverge from
the Index. In 2014, using these
internals alone would have made a 9% return vs. 13% for the S&P 500 (in on
Positive, out on Negative – no shorting).
Using the Short-term indicator in 2018 in SPY would have
made a 5% gain instead of a 6% loss for buy-and-hold. The methodology was Buy
on a POSITIVE indication and Sell on a NEGATIVE indication and stay out until
the next POSITIVE indication. The back-test included 13-buys and 13-sells, or a
trade every 2-weeks on average.
My current stock allocation is about 40% invested in
stocks. You may wish to have a higher or lower % invested in stocks depending
on your risk tolerance. 40% is a conservative position that I re-evaluate
daily. It is not far below my fully invested position which would be between
50-60%.
As a retiree, 50% in the stock market is about fully
invested for me – it is a cautious and conservative number. If I feel very
confident, I might go to 60%; had we seen a successful retest of the bottom,
80% would not have been out of the question.