“Trade what you see; not what you think.” – The Old Fool,
Richard McCranie, trader extraordinaire.
“The big money is not in the buying and selling. But in
the waiting.” - Charlie Munger, Vice Chairman, Berkshire Hathaway
“People always ask me what is going on in the markets. It
is simple. Greatest Speculative Bubble of All Time in All Things. By two orders
of magnitude.” – Michael “Big Short” Burry.
“I never imagined that I would see the day that the
Chairman of the House Judiciary Committee would step forward to call for raw [Supreme]
court packing. It is a sign of our current political environment where rage
overwhelms reason.” - Professor Jonathan Turley, honorary Doctorate of Law from
John Marshall Law School for his contributions to civil liberties and the
public interest.
Baseball fans will understand this joke...

JOBLESS CLAIMS (Fox Business)
“The number of Americans filing for first-time unemployment benefits
last week unexpectedly rose off the lowest levels since the outbreak of
the COVID-19 pandemic. Data released Thursday by the Labor
Department showed 373,000 Americans filed for first-time jobless benefits in
the week ended July 3...” Story at...
https://www.foxbusiness.com/economy/jobless-claims-unexpectedly-rise-off-pandemic-lows
EIA CRUDE INVENTORIES (EIA)
“U.S. commercial crude oil inventories (excluding those
in the Strategic Petroleum Reserve) decreased by 6.9 million barrels from the
previous week. At 445.5 million barrels, U.S. crude oil inventories are about
7% below the five year average for this time of year.” Press release at...
https://ir.eia.gov/wpsr/wpsrsummary.pdf
WHAT WALL STREET THINKS ABOUT THE SHOCKING PLUNGE IN BOND
YIELDS (ZeroHedge)
“...firms either have to push up wages to satisfy demand,
driving a potential inflationary spiral, or hold back on expectation that
conditions will normalize, further depressing economic output and sparking even
more deflationary fears. As Authers [Bloomberg reporter] correctly concludes,
"either outcome leads to an economic mess that persists well into next
year at least." It is this mess that the bond market is currently
trying to sift through and make some sense of what the economy would look like
on the other side...” Commentary at...
https://www.zerohedge.com/markets/heres-what-wall-street-thinks-behind-collapse-treasury-yields
CORONAVIRUS (NTSM)
Here’s the latest from the COVID19 Johns Hopkins website as
of 5:30 PM Thursday. US total case numbers are on the left axis; daily numbers
are on the right side of the graph with the 10-dMA of daily numbers in Green.
Daily case numbers keep rising. Does this justify a major
correction? Probably not.

MARKET REPORT / ANALYSIS
-Thursday the S&P 500 fell about 0.9% to 4321.
-VIX jumped about 17% to 19.00.
-The yield on the 10-year Treasury slipped to 1.298%.
Wednesday, the S&P 500
made a new all-time high today while 6.5% of issues on the NYSE made
new-52-week highs. That’s about average for 52-week-highs when the Index makes
a new high – that’s a good sign that the advance is reasonably broad. If we were to have a pullback, it suggests
that the drop would be less than 10%.
The daily sum of 20 Indicators dipped from -2 to -6 (a
positive number is bullish; negatives are bearish); the 10-day smoothed sum
that smooths the daily fluctuations improved from +9 to +10. (These numbers
sometimes change after I post the blog based on data that comes in late.) Most
of these indicators are short-term and many are trend following.
My Short-Term indicator ensemble flipped to Bearish
today. Updating yesterday’s comment:
Up volume has been falling
over the last several sessions. The 10-dMA of up-volume has slipped to 45%
today, indicating that less than half of the volume has been up over the last 2
weeks. Only 49% of issues on the NYSE have been up over the last 2 weeks.
These stats suggest that we
may see some trouble in the markets. It’s not a done deal though, today was a
statistically significant down-day. That just means that the price-volume move
exceeded my statistical parameters. Data shows that a
statistically-significant, down-day is followed by an up-day about 60% of the
time.
The Long Term NTSM indicator
ensemble remained HOLD. Volume is bullish; Price, VIX & Sentiment are neutral.
There are currently no top-indicators warning of a top.
I’m cautiously bullish, but a
down day tomorrow would be a little worrisome. The 50-dMA is 2.4% below today’s
close. I don’t expect the Index to drop
that far, but it could happen. I’d be surprised if the Index fell below the
50-day, but I have been wrong before.
MOMENTUM ANALYSIS:
TODAY’S RANKING OF 15 ETFs
(Ranked Daily)
The top ranked ETF receives
100%. The rest are then ranked based on their momentum relative to the leading
ETF.

*For additional background on
the ETF ranking system see NTSM Page at…
http://navigatethestockmarket.blogspot.com/p/exchange-traded-funds-etf-ranking.html
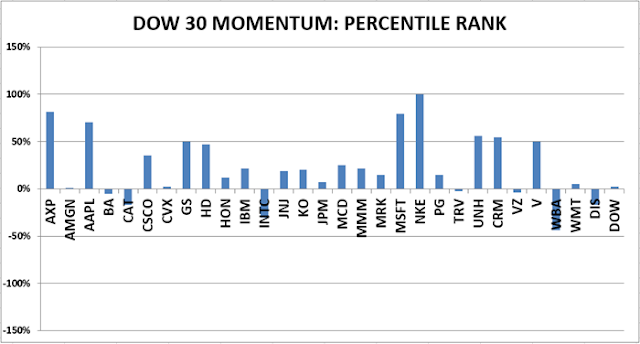
TODAY’S RANKING OF THE DOW 30
STOCKS (Ranked Daily)
Here’s the revised DOW 30 and
its momentum analysis. The top ranked stock receives 100%. The rest are then
ranked based on their momentum relative to the leading stock.
For more details, see NTSM
Page at…
https://navigatethestockmarket.blogspot.com/p/a-system-for-trading-dow-30-stocks-my_8.html
THURSDAY MARKET INTERNALS
(NYSE DATA)

Market Internals are a decent
trend-following analysis of current market action, but should not be used alone
for short term trading. They are usually right, but they are often late. They are most useful when they diverge from
the Index.
Using the Short-term indicator in 2018 in SPY would have made a 5% gain instead of a 6% loss for buy-and-hold. The methodology was Buy on a POSITIVE indication and Sell on a NEGATIVE indication and stay out until the next POSITIVE indication. The back-test included 13-buys and 13-sells, or a trade every 2-weeks on average.
As of 25 May, my
stock-allocation is about 50% invested in stocks. I am not super bullish and I
am watching the markets closely. For now, 50% is a reasonable allocation for
me.
You may wish to have a higher
or lower % invested in stocks depending on your risk tolerance. 50% is a
conservative position that I consider fully invested for most retirees. As a
retiree, 50% in the stock market is about fully invested for me – it is a
cautious and conservative number. If I feel very confident, I might go to 60%;
if a correction is deep enough, and I can call a bottom, 80% would not be out
of the question.