“Trade what you see; not what you think.” – The Old Fool,
Richard McCranie, trader extraordinaire.
“The big money is not in the buying and selling. But in
the waiting.” - Charlie Munger, Vice Chairman, Berkshire Hathaway
“People always ask me what is going on in the markets. It
is simple. Greatest Speculative Bubble of All Time in All Things. By two orders
of magnitude.” – Michael “Big Short” Burry.
“I never imagined that I would see the day that the
Chairman of the House Judiciary Committee would step forward to call for raw [Supreme]
court packing. It is a sign of our current political environment where rage
overwhelms reason.” - Professor Jonathan Turley, honorary Doctorate of Law from
John Marshall Law School for his contributions to civil liberties and the
public interest.
PAYROLL REPORT / UNEMPLOYMENT RATE / AVG HOURLY EARNINGS
(Yahoo Finance)
“The U.S. Labor Department released its June jobs report
Friday morning at 8:30 a.m. ET...
Change in non-farm payrolls: 850,000
vs. 720,000 expected; Unemployment rate: 5.9%; Average hourly earnings,
month-over-month: 0.3%...” Story at...
FACTORY ORDERS (Briefing.com)
“Factory orders for manufactured goods increased 1.7% m/m
in May (Briefing.com consensus 1.7%) after decreasing an upwardly revised 0.1%
(from -0.6%) in April.” Story at...
VIX OPEN INTEREST FALLING – NOT A FEATURE AT TOPS
(McClellan Financial Publicatons)
“...having VIX open interest below the 200MA is useful
for ruling out the possibility that prices are now at a major top. It is
a missing topping condition. So we [now] have some assurance that there
should still be a lot more for prices to run higher. At the point when we
see hedge funds getting excited again about trading the VIX futures, and see
open interest numbers rising up to well above the 200MA, then we can worry
about a meaningful top for stock prices.” Commentary at...
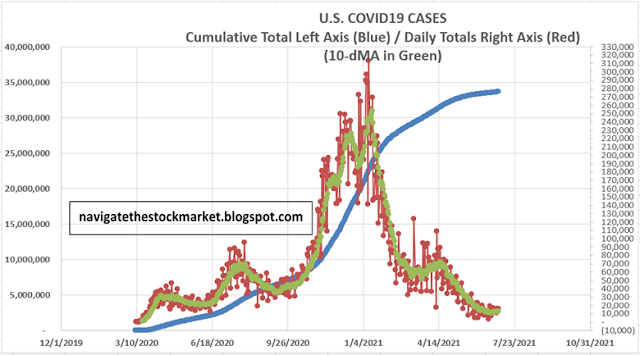
CORONAVIRUS (NTSM)
Here’s the latest from the COVID19 Johns Hopkins website as
of 10:30 PM Friday. US total case numbers are on the left axis; daily numbers
are on the right side of the graph with the 10-dMA of daily numbers in Green.
MARKET REPORT / ANALYSIS
-Friday the S&P 500 rose about 0.8% to 4352.
-VIX slipped about 2% to 15.07.
-The yield on the 10-year Treasury slipped to 1.437%.
Have a happy and safe Fourth of July Holiday – Markets
are closed Monday.
https://www.youtube.com/watch?v=-f5WRrUJu-8
For guitar players out there, this piece is included in
Guy Van Duser’s, Mel Bay book, “Stride Guitar.”
Here’s Friday’s run-down of some important indicators.
These tend to be both long-term and short-term, so they are somewhat different
than the 20 that I report on daily.
BULL SIGNS
-The 10-dMA of issues advancing on the NYSE
(Breadth) is above 50%
-The 50-dMA % of issues advancing on the NYSE (Breadth)
is above 50%.
-The 100-dMA of the % of issues advancing on the
NYSE (Breadth) is above 50%.
-The 5-10-20 Timer System is BUY; the 5-dEMA and 10-dEMA are
both above the 20-dEMA.
-MACD of the percentage of issues advancing on the NYSE
(breadth) made a bearish crossover 16 June, but has improved and is now a
whisker away from a bullish crossover..
-Short-term new-high/new-low data is higher.
-Statistically, the S&P 500 gave a panic-signal, 18
June, but the signal has expired.
-The Smart Money (late-day action) is improving. (This
indicator is based on the Smart Money Indicator developed by Don Hayes).
-MACD of S&P 500 price made a bullish crossover
today, 25 June.
-My Money Trend indicator is headed up.
-The smoothed advancing volume on the NYSE is rising.
-The S&P 500 is out-performing the Utilities ETF
(XLU), and trending higher - bullish.
-69% of the 15-ETFs that I track have been up over the
last 10-days.
NEUTRAL
-Breadth on the NYSE compared to the S&P 500 index is
neutral.
-We had 2 Distribution Days recently, but not enough to
send a signal.
-RSI – neutral
-VIX is falling, but not fast enough to send a signal -
neutral.
-Non-crash Sentiment indicator remains neutral, but it is
very bullish and that means the signal is leaning bearish.
-There have been 13 up-days over the last 20 days.
Neutral
-The Fosback High-Low Logic Index is neutral.
-There have been 3 Statistically-Significant days in the
last 15-days. Neutral.
-The market remains fairly broad; 6.2% of all
issues traded on the NYSE made new, 52-week highs when the S&P 500 made a
new all-time-high 11 June. (There is no bullish signal for this indicator.)
This is slightly below average, but it still indicates decent breadth.
-4 June, the 52-week, New-high/new-low ratio improved by 0.4
standard deviations, somewhat bullish, but it has expired.
-Long-term new-high/new-low data is flat.
-The size of up-moves has been larger than the size of
down-moves over the last month, but not enough to give a signal.
BEAR SIGNS
-Bollinger Bands are overbought (a
bearish sign).
-The S&P 500 is 13.2% above its 200-dMA (Sell point
is 12%.). This value was 15.9% above the 200-dMA when the 10% correction
occurred in Sep 2020.has
-McClellan Oscillator is mildly bearish.
-Slope of the 40-dMA of New-highs is falling. This is one
of my favorite trend indicators so this is worrisome.
-There have been 9 up-days over the last 10-days. The
last time this happened was at the top of a 10% correction back in September of
2020. This indicator is usually right, but not always.
-Cyclical Industrials (XLI-ETF) are under-performing the
S&P 500 - bearish.
-Overbought/Oversold Index (Advance/Decline Ratio) is
overbought.
On Friday, 21 February, 2 days after the top of the
Coronavirus pullback, there were 10 bear-signs and 1 bull-sign. Now there are 7
bear-signs and 13 bull-signs. Last week, there were 8 bear-signs and 11
bull-signs. Indicators keep improving.
The daily sum of 20 Indicators improved from +3 to +5 (a
positive number is bullish; negatives are bearish); the 10-day smoothed sum
that smooths the daily fluctuations improved from -27 to -10. (These numbers
sometimes change after I post the blog based on data that comes in late.) Most
of these indicators are short-term and many are trend following.
The Long Term NTSM indicator ensemble
remained HOLD. Volume is bullish; Price, VIX & Sentiment are neutral.
There are currently only 2
top-indicators warning of a top; the Index is stretched too far ahead of its
200-dMA, but just barely; and Bollinger Bands are “overbought”, an indication that
the S&P 500 is more than 2 std deviations above the norm. If RSI also turns
overbought, we’ll need to consider the possibility of a top.
There have been 7 up-days in a
row; 9 out of the last 10 days have been up-days while 13 out of the last 20
have been up. That’s elevated, and bordering on bearish. As I said yesterday, and
was wrong, but I’ll say it again, expect a down-day Tuesday.
As noted yesterday, I’m getting
more bullish. It appears that the long
malaise, consisting of a flat Index going back to early May, is ending. In
short, it looks like the Index is breaking out to the upside.
I’ll probably add Technology (XLK-ETF)
and American Express (AXP) to replace issues I sold this week. I think Financials
(XLF-ETF) are a sell too.
MOMENTUM ANALYSIS:
TODAY’S RANKING OF 15 ETFs
(Ranked Daily)
The top ranked ETF receives
100%. The rest are then ranked based on their momentum relative to the leading
ETF.

*For additional background on
the ETF ranking system see NTSM Page at…
http://navigatethestockmarket.blogspot.com/p/exchange-traded-funds-etf-ranking.html
TODAY’S RANKING OF THE DOW 30
STOCKS (Ranked Daily)
Here’s the revised DOW 30 and
its momentum analysis. The top ranked stock receives 100%. The rest are then
ranked based on their momentum relative to the leading stock.

For more details, see NTSM
Page at…
https://navigatethestockmarket.blogspot.com/p/a-system-for-trading-dow-30-stocks-my_8.html
FRIDAY MARKET INTERNALS (NYSE
DATA)

Market Internals remained BULLISH on the market.
Market Internals are a decent
trend-following analysis of current market action, but should not be used alone
for short term trading. They are usually right, but they are often late. They are most useful when they diverge from
the Index.
Using the Short-term indicator
in 2018 in SPY would have made a 5% gain instead of a 6% loss for buy-and-hold.
The methodology was Buy on a POSITIVE indication and Sell on a NEGATIVE
indication and stay out until the next POSITIVE indication. The back-test
included 13-buys and 13-sells, or a trade every 2-weeks on average.
As of 25 May, my
stock-allocation is about 45-50% invested in stocks. I am not super bullish and I
am watching the markets closely. For now, 50% is a reasonable allocation for
me.
You may wish to have a higher
or lower % invested in stocks depending on your risk tolerance. 50% is a
conservative position that I consider fully invested for most retirees. As a
retiree, 50% in the stock market is about fully invested for me – it is a
cautious and conservative number. If I feel very confident, I might go to 60%;
if a correction is deep enough, and I can call a bottom, 80% would not be out
of the question.