“Trade what you see; not what you think.” – The Old Fool,
Richard McCranie, trader extraordinaire.
“The big money is not in the buying and selling. But in
the waiting.” - Charlie Munger, Vice Chairman, Berkshire Hathaway
“People always ask me what is going on in the markets. It
is simple. Greatest Speculative Bubble of All Time in All Things. By two orders
of magnitude.” – Michael “Big Short” Burry.

RETAIL SALES (CNBC)
“U.S. retail sales unexpectedly increased in June as
demand for goods remained strong even as spending is shifting back to services,
bolstering expectations that economic growth accelerated in the second quarter...Retail
sales rose 0.6% last month.” Story at...
https://www.cnbc.com/2021/07/16/us-retail-sales-unexpectedly-rise-0point6percent-in-june-.html
UNIVERSITY OF MICHIGAN SENTIMENT (Detroit News)
“U.S. consumer sentiment unexpectedly declined to a
five-month low in early July as mounting concerns over rising prices led to a
sharp deterioration in buying conditions for big-ticket items. The University
of Michigan's preliminary sentiment index decreased to 80.8 in July from 85.5
the prior month...” Story at...
CORONAVIRUS (NTSM)
Here’s the latest from the COVID19 Johns Hopkins website as
of 9:30 PM Friday. US total case numbers are on the left axis; daily numbers
are on the right side of the graph with the 10-dMA of daily numbers in Green.
Big jump in new cases Friday!

MARKET REPORT / ANALYSIS
-Friday the S&P 500 dipped about 0.8% to 4327.
-VIX rose about 8% to 18.45.
-The yield on the 10-year Treasury slipped to 1.294%.
Here’s Friday’s run-down of some important indicators.
These tend to be both long-term and short-term, so they are somewhat different
than the 20 that I report on daily.
BULL SIGNS
-The 50-dMA % of issues advancing on the NYSE (Breadth)
is above 50%.
-The 100-dMA of the % of issues advancing on the
NYSE (Breadth) is above 50%.
-The 5-10-20 Timer System is BUY; the 5-dEMA and 10-dEMA are
both above the 20-dEMA.
-Slope of the 40-dMA of New-highs is rising, but just
barely. This is one of my favorite trend indicators.
NEUTRAL
-Bollinger Bands remain neutral.
-RSI.
-Breadth on the NYSE compared to the S&P 500 index is
neutral.
-Statistically, the S&P 500 gave a panic-signal, 18
June, but the signal has expired.
-Non-crash Sentiment indicator remains neutral, but it is
very bullish and that means the signal is leaning bearish.
- 6.4% of all issues traded on the NYSE made new,
52-week highs when the S&P 500 made a new all-time-high 12 July. (There is
no bullish signal for this indicator.) This is about average - no alarm here.
-The S&P 500 is 11.6% above its 200-dMA (Sell point
is 12%.). This value was 15.9% above the 200-dMA when the 10% correction
occurred in Sep 2020.
-The Fosback High-Low Logic Index is neutral.
-Overbought/Oversold Index (Advance/Decline Ratio) is
neutral.
-Long-term new-high/new-low data is flat.
-There have been 3 Statistically-Significant days in the
last 15-days. Neutral.
-4 June, the 52-week, New-high/new-low ratio improved by 0.4
standard deviations, somewhat bullish, but it has expired.
-The size of up-moves has been smaller than the size of down-moves
over the last month, but not enough to give a signal.
-There have been 13 up-days over the last 20 days.
Neutral
-There have been 5 up-days over the last 10-days.
-VIX.
BEAR SIGNS
-The 10-dMA of issues advancing on the NYSE
(Breadth) is below 50%.
-MACD of S&P 500 price made a bearish crossover today,
16 July.
-MACD of the percentage of issues advancing on the NYSE
(breadth) made a bearish crossover 16 June, and has not yet changed its mind.
-McClellan Oscillator is bearish.
-The Smart Money (late-day action) is falling fast. (This
indicator is based on the Smart Money Indicator developed by Don Hayes). The
Pros are selling.
-Short-term new-high/new-low data is falling.
-We’ve had 6 Distribution Days over the last 3 weeks. I
am getting more confidence in this indicator.
-My Money Trend indicator is on the bear side.
-Cyclical Industrials (XLI-ETF) are under-performing the
S&P 500 - bearish.
-The smoothed advancing volume on the NYSE is falling.
-The S&P 500 is out-performing the Utilities ETF
(XLU), but it is trending sharply in the wrong direction so I will put this in
the bear category.
-43% of the 15-ETFs that I track have been up over the
last 10-days.
On Friday, 21 February, 2 days after the top of the
Coronavirus pullback, there were 10 bear-signs and 1 bull-sign. Now there are 12
bear-signs and 4 bull-signs. Last week, there were 8 bear-signs and 10
bull-signs. Indicators slipped a little this week but not much.
The above indicators have turned quite bearish over the
last week. Unfortunately, they don’t give us too many clues about how bad a
pullback might be coming. Given that the number of 52-week highs was about
average at the S&P 500 recent top, we might conclude that a pullback (if
indeed we do have one) would be less than 10%.
Today was a statistically-significant, down-day under my
system which often (about 60% of the time) follows with an up day. Statistically-significant,
down-days do happen at bottoms, however, the Index is not at the bottom of its trend
line so we probably have not made a bottom.
Today’s close for the S&P 500 was 2.1% above its 50-dMA.
In recent retreats the 50-dMA has been a point of strong support. This time I
think we’ll go lower. Inflationary fears and Covid variants are worries so maybe
we’ll have that 10% correction? Perhaps, but none of the indicators in the long-term
ensemble are bearish and I suspect they will need to turn bearish before we see
declines much below 5% off the top.
The daily sum of 20 Indicators declined from -7 to -10 (a
positive number is bullish; negatives are bearish); the 10-day smoothed sum
that smooths the daily fluctuations fell from -29 to -42. (These numbers
sometimes change after I post the blog based on data that comes in late.) Most
of these indicators are short-term and many are trend following.
The Long Term NTSM indicator
remained HOLD. VIX, Volume, Price & Sentiment are neutral.
There are currently no top-indicators
warning of a top.
I continue to expect more
weakness. The main clues are: Breadth (10-dMA of % of
issues advancing on the NYSE) keeps falling; my basket of internals remains
negative; and today's run down of indicators is solidly bearish.
MOMENTUM ANALYSIS:
TODAY’S RANKING OF 15 ETFs
(Ranked Daily)
The top ranked ETF receives
100%. The rest are then ranked based on their momentum relative to the leading
ETF.

*For additional background on
the ETF ranking system see NTSM Page at…
http://navigatethestockmarket.blogspot.com/p/exchange-traded-funds-etf-ranking.html
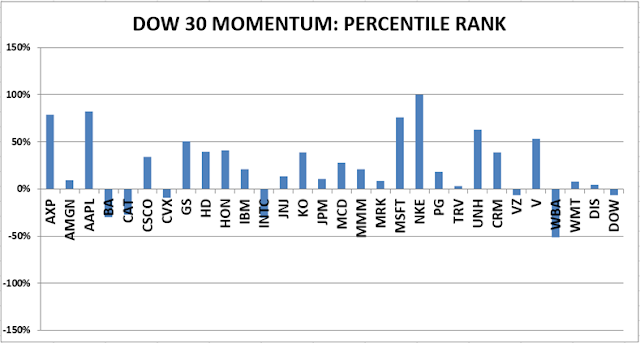
TODAY’S RANKING OF THE DOW 30
STOCKS (Ranked Daily)
Here’s the revised DOW 30 and
its momentum analysis. The top ranked stock receives 100%. The rest are then
ranked based on their momentum relative to the leading stock.
For more details, see NTSM
Page at…
https://navigatethestockmarket.blogspot.com/p/a-system-for-trading-dow-30-stocks-my_8.html
FRIDAY MARKET INTERNALS (NYSE
DATA)

Market Internals remained BEARISH on the market.
Market Internals are a decent trend-following
analysis of current market action, but should not be used alone for short term
trading. They are usually right, but they are often late. They are most useful when they diverge from
the Index.
Using the Short-term indicator in 2018 in SPY would have made a 5% gain instead of a 6% loss for buy-and-hold. The methodology was Buy on a POSITIVE indication and Sell on a NEGATIVE indication and stay out until the next POSITIVE indication. The back-test included 13-buys and 13-sells, or a trade every 2-weeks on average.
As of 15 July, my
stock-allocation is about 45% invested in stocks since I took profits in XLE
due to its falling momentum. I’ll probably wait to see what the market is doing
before I put those funds back to work. I am not super bullish (or bearish) and
I am watching the markets closely.
You may wish to have a higher or
lower % invested in stocks depending on your risk tolerance. 50% is a
conservative position that I consider fully invested for most retirees. As a
retiree, 50% in the stock market is about fully invested for me – it is a
cautious and conservative number. If I feel very confident, I might go to 60%;
if a correction is deep enough, and I can call a bottom, 80% would not be out
of the question.