“Trade what you see; not what you think.” – The Old Fool,
Richard McCranie, trader extraordinaire.
RETAIL SALES (CNBC)
“Retail sales posted a surprise gain in August despite
fears that escalating Covid cases and supply chain issues would hold back
consumers, the Census Bureau reported Thursday. Sales increased 0.7% for the
month...” Story at...
JOBLESS CLAIMS (Yahoo Finance)
“New weekly jobless claims rose from a pandemic-era low
last week, pointing to sustained improvements in the labor market's recovery...
Initial unemployment claims, week ended
September 11: 332,000 vs. 322,000 expected...” Story at...
https://finance.yahoo.com/news/weekly-jobless-claims-week-ended-september-11-2021-190708680.html
PHILADELPHIA FED INDEX (Reuters)
“Growth in factory activity in the U.S. mid-Atlantic
region slowed for the fourth consecutive month in August after hitting its
highest pace in nearly half a century earlier this spring...The Philadelphia
Federal Reserve Bank said its business activity index fell to 19.4...Any
reading above zero indicates expansion in the region's manufacturing.” Story
at...
CORONAVIRUS (NTSM)
Here’s the latest from the COVID19 Johns Hopkins website as
of 8:30 PM Thursday. U.S. total case numbers are on the left axis; daily
numbers are on the right side of the graph in Red with the 10-dMA of daily
numbers in Green.
I added the smoothed 10-dMA of new cases (in purple) to
the chart. One can see it is off its peak, so perhaps we have seen the worst of
the Delta-variant.

MARKET REPORT / ANALYSIS
-Thursday the S&P 500 slipped about 0.2% to 4474.
-VIX rose about 3% to 18.69.
-The yield on the 10-year Treasury were little changed at
1.335%.
The S&P 500 moved down to near its 50-dMA (now 4433) this
morning around 11 am. It bounced up from there, but sold off in the the last
hour or so of trading. The Index closed about
1.4% below the recent all-time high, so talk of a correction/pullback may be a
bit premature.
The daily sum of 20 Indicators remained -8 (a positive
number is bullish; negatives are bearish); the 10-day smoothed sum that smooths
the daily fluctuations declined from -43 to -55. (These numbers sometimes
change after I post the blog based on data that comes in late.) Most of these
indicators are short-term and many are trend following.
The Long Term NTSM indicator ensemble
remained HOLD. Price is bullish; VIX, Volume & Sentiment indicators are
neutral.
I’m bearish for now, but I can
be swayed if indicators improve enough. Tomorrow’s Friday Indicator run down
should be interesting.
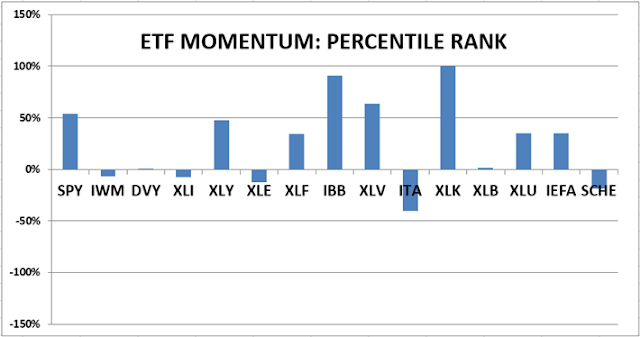
MOMENTUM ANALYSIS:
TODAY’S RANKING OF 15 ETFs
(Ranked Daily)
The top ranked ETF receives
100%. The rest are then ranked based on their momentum relative to the leading
ETF.
*For additional background on
the ETF ranking system see NTSM Page at…
http://navigatethestockmarket.blogspot.com/p/exchange-traded-funds-etf-ranking.html
TODAY’S RANKING OF THE DOW 30
STOCKS (Ranked Daily)
Here’s the revised DOW 30 and
its momentum analysis. The top ranked stock receives 100%. The rest are then
ranked based on their momentum relative to the leading stock.

For more details, see NTSM
Page at…
https://navigatethestockmarket.blogspot.com/p/a-system-for-trading-dow-30-stocks-my_8.html
THURSDAY MARKET INTERNALS
(NYSE DATA)

Market Internals remained BEARISH on the market.
Market Internals are a decent
trend-following analysis of current market action, but should not be used alone
for short term trading. They are usually right, but they are often late. They are most useful when they diverge from
the Index.
My stock-allocation is now
about 45% invested in stocks; this is slightly below my “normal” fully invested
allocation of 50%.
You may wish to have a higher
or lower % invested in stocks depending on your risk tolerance. 50% is a
conservative position that I consider fully invested for most retirees.
As a general rule, some
suggest that the % of portfolio invested in the stock market should be one’s
age subtracted from 100. So a 30 year
old person would have 70% of the portfolio in stocks, stock mutual funds and/or
stock ETFs. That’s ok, but for older
investors, I usually don’t recommend keeping less than 50% invested in stocks
(as a fully invested position) since most people need some growth in the
portfolio to keep up with inflation.