“Trade what you see; not what you think.” – The Old Fool,
Richard McCranie, trader extraordinaire.
JOBLESS CLAIMS (YahooFinance)
“Weekly jobless claims rose after setting a more than
five-decade low last week. Still, however, new claims came in near pre-pandemic
levels, highlighting ongoing improvements in the labor market...Initial unemployment claims,
week ended November 27: 222,000 vs. 240,000 expected”
Story at...
IS A CRASH LIKE 2000 POSSIBLE? (RIA)
“The benefit of using the ratio price to sales (P/S)
versus P/E is that sales, or revenue, are not easy to manipulate by
executives...the price to sales ratio (P/S) is now 50% above where it was in
1999...15% of the S&P 500 stocks have a P/S ratio greater than ten. That
compares to 8% in 1999.” [Does 10x sales make sense?]
‘At 10 times revenues, to give you a 10-year payback, I have
to pay you 100% of revenues for 10 straight years in dividends. That assumes I
can get that by my shareholders. It assumes I have zero cost of
goods sold, which is very hard for a computer company. That assumes zero
expenses, which is really hard with 39,000 employees. That assumes I pay no
taxes, which is very hard. And that assumes you pay no taxes on your dividends,
which is kind of illegal. And that assumes with zero R&D for the next 10
years, I can maintain the current revenue run rate. Now, having done that,
would any of you like to buy my stock at $64? Do you realize how ridiculous
those basic assumptions are?’” - Scott McNeely, CEO of Sun
Microsystems, 1999. Commentary at...
https://realinvestmentadvice.com/is-a-stock-market-crash-like-2000-possible
A good bit of the market is working on “The Greater Fool”
theory, i.e., there will always be a bigger fool to buy my stock when I get ready
to sell.
INDICATOR THAT PREDICTED THE 1987 CRASH IS FLASHING RED [Now
Predicting a 10% Correction] (msn.com)
“Pursche, of Wealthspire, said the sentiment imbalance
may well point to a 10% correction but he didn’t believe the current bull
market was close to expiry. The economic backdrop has not yet changed, despite
speculation about the threat from the omicron variant of Covid 19. “Sentiment
matters greatly in the short term, fundamentals matter much more in the long
term,” says. Pursche.” Story at...
A
Stock Market Indicator That Predicted the 1987 Crash Is Flashing Red (msn.com)
CORONAVIRUS (NTSM)
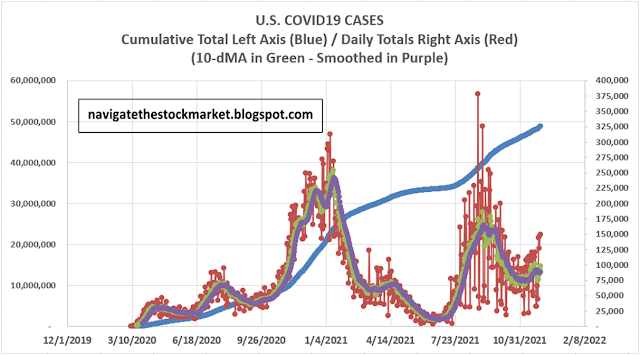
Here’s the latest from the COVID19 Johns Hopkins website
as of 6:00 PM Thursday. U.S. total case numbers are on the left axis; daily
numbers are on the right side of the graph in Red with the 10-dMA of daily
numbers in Green. I added the smoothed 10-dMA of new cases (in purple) to the
chart.
I have been watching a slight down tick in new cases on
the chart. The problem is that starting
with Monday of this week, new-cases have been between 130,000 and 150,000
(today), well above the smoothed 10-dMA. I suspect the downturn may be a fakeout
that results from weak reporting over the 4 -day Thanksgiving holiday period.
We’ll see.
MARKET REPORT / ANALYSIS
-Thursday the S&P 500 rose about 1.4% to 4577.
-VIX dropped about 11% to 27.73.
-The yield on the 10-year Treasury slipped to 1.431%.
(Perhaps the Bond Gurus are not convinced the downturn is over?)
Yesterday, we got lower volume on the NYSE (indicating
reduced selling), but internals were little improved so I was not convinced
that Wednesday was a bottom. The reversal in price was bearish, too, but after
today’s bullish move, maybe we should look again. Was Wednesday the bottom of another
quick downturn?
Looking at the market we see some bull signs Thursday:
-The S&P 500 closed 0.7% above its 50-dMA.
-Utilities were strong, but they did underperform the
S&P 500.
-Cyclical Industrials outperformed by a lot today.
-83% of volume was up-volume
But a lot of bear signs remain...
-Moving averages of Breadth (issues advancing on the
NYSE) remained in bear territory, but these naturally lag.
-The 40-dMA of new-highs is still falling, another
lagging indicator.
-New-high/new-low data continues to look very weak. There were only 9 new-highs today with 175
new-lows. This didn’t even move my scale
for improvement.
-The smart money (late-day action) is still headed down.
The new-high/new-low stats bother more than other
indicators. If Wednesday was a bottom, new-highs/new-lows
should have improved more Thursday.
The action today supports a down day tomorrow. Today
was another statistically significant up-day. That means that the price-volume
move exceeded my statistical parameters. Statistics show that a
statistically-significant, up-day is followed by a down-day about 60% of the
time. Daily indicators didn’t improve by much either.
The daily sum of 20 Indicators improved from -17 to – 15 (a
positive number is bullish; negatives are bearish); the 10-day smoothed sum
that smooths the daily fluctuations declined from -113 to -119 (These numbers
sometimes change after I post the blog based on data that comes in late.) Most
of these indicators are short-term so they tend to bounce around a lot.
The Long Term NTSM indicator ensemble remained SELL. VIX & Volume are bearish; Price & Sentiment are Neutral.
All-in-all, I am not yet convinced
that Wednesday was the bottom. I would
change my mind if we see another strong positive move up accompanied by improvements
in indicators, especially if we have another high up-volume day with up-volume
>80% of total volume.
I remain bearish, but I’ll be
checking the data Friday. Friday’s run-down of indicators will be interesting.
MOMENTUM ANALYSIS:
TODAY’S RANKING OF 15 ETFs
(Ranked Daily)
The top ranked ETF receives
100%. The rest are then ranked based on their momentum relative to the leading
ETF.

*For additional background on
the ETF ranking system see NTSM Page at…
http://navigatethestockmarket.blogspot.com/p/exchange-traded-funds-etf-ranking.html
TODAY’S RANKING OF THE DOW 30
STOCKS (Ranked Daily)
Here’s the revised DOW 30 and
its momentum analysis. The top ranked stock receives 100%. The rest are then
ranked based on their momentum relative to the leading stock.

For more details, see NTSM
Page at…
https://navigatethestockmarket.blogspot.com/p/a-system-for-trading-dow-30-stocks-my_8.html
THURSDAY MARKET INTERNALS
(NYSE DATA)

Market Internals improved to HOLD.
Market Internals are a decent
trend-following analysis of current market action, but should not be used alone
for short term trading. They are usually right, but they are often late. They are most useful when they diverge from the
Index.
I’ll be a buyer when we can
see an end to the current weakness.
My stock-allocation in the
portfolio is now about 35% invested in stocks; this is well below my “normal”
fully invested stock-allocation of 50%.
You may wish to have a higher
or lower % invested in stocks depending on your risk tolerance. 50% is a
conservative position that I consider fully invested for most retirees.
As a general rule, some
suggest that the % of portfolio invested in the stock market should be one’s
age subtracted from 100. So, a
30-year-old person would have 70% of the portfolio in stocks, stock mutual
funds and/or stock ETFs. That’s ok, but
for older investors, I usually don’t recommend keeping less than 50% invested
in stocks (as a fully invested position) since most people need some growth in
the portfolio to keep up with inflation.