“Trade what you see; not what you think.” – The Old Fool, Richard McCranie, trader extraordinaire.
“The volume of sales came in at a seasonally adjusted annual rate of 603,000, down 10.9% from the previous month’s revised pace of 677,000 and 17.6% below year ago levels...” Story at...
https://money.yahoo.com/new-home-sales-140626719.html
“U.S. commercial crude oil inventories (excluding those in the Strategic Petroleum Reserve) increased by 2.6 million barrels from the previous week. At 439.9 million barrels, U.S. crude oil inventories are about 2% below the five year average for this time of year.” Report at...
https://ir.eia.gov/wpsr/wpsrsummary.pdf
“Let’s turn to the NASDAQ and the number of stocks making new 52 week lows. On the right side of the chart I drew a blue line to show that each successive lower low in price has been accompanied by less stocks making new lows. That indicates a loss of downside momentum and a positive divergence or non-confirmation. This kind of behavior is almost always seen at market bottoms.
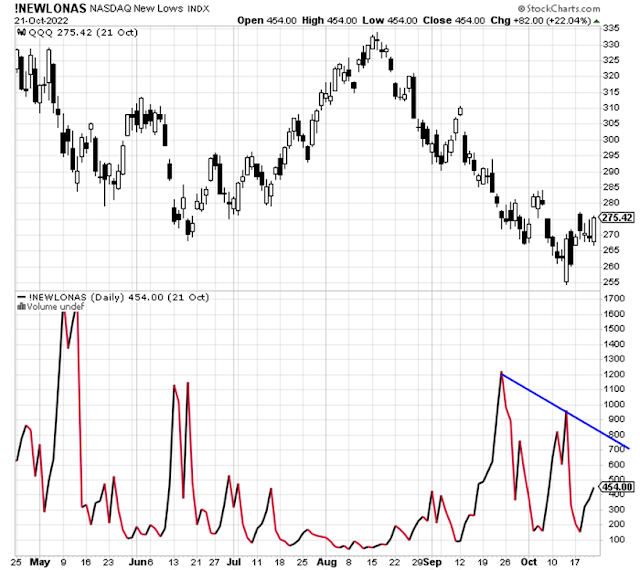
Remember, the markets will bottom (and they may have already) long before the Fed stops raising rates and even pivots.” – Paul Schatz, President heritage Capital. Commentary at...
https://investfortomorrow.com/blog/confounding-the-masses/
-Wednesday the S&P 500 dropped about 0.7% to 3831.
-VIX bucked the trend and dipped about 4% to 27.28.
-The yield on the 10-year Treasury slipped to 4.007%.
-Drop from Top: 20.1% as of today. 25.4% max (on a closing basis).
-Trading Days since Top: 205-days.
The S&P 500 is 7.1% Below its 200-dMA & 0.7% Below its 50-dMA.
*I won’t call the correction over until the S&P 500 makes a new-high; however, evidence suggests the bottom was / is in the 3600 area and I am fully invested with a higher percentage of stocks than normal.
XLI – Industrial ETF
QLD – 2x Nas 100
DDM – 2x Dow 30
XLK – Technology ETF
In theory, the S&P 500 was rejected at its 50-dMA and fell from there giving a bearish signal. Sorry, I don’t buy that analysis. Market Internals looked very good today and VIX was down; I expect that the major indeces will follow higher, either tomorrow or very soon thereafter. Futures are up as I write this, so others are agreeing with me.
TODAY’S RANKING OF 15 ETFs (Ranked Daily)
ETF ranking follows:
The top ranked ETF receives 100%. The rest are then ranked based on their momentum relative to the leading ETF.
#1. XLE #2. ITA #2. IBB (ITA & IBB Tied)

*For additional background on the ETF ranking system see NTSM Page at…
http://navigatethestockmarket.blogspot.com/p/exchange-traded-funds-etf-ranking.html
DOW 30 momentum ranking follows:
#1. CVX #2. MRK #3. AMGN

For more details, see NTSM Page at…
https://navigatethestockmarket.blogspot.com/p/a-system-for-trading-dow-30-stocks-my_8.html

(Market Internals are a decent trend-following analysis of current market action, but should not be used alone for short term trading. They are most useful when they diverge from the Index.)