“Trade what you see; not what you think.” – The Old Fool, Richard McCranie, trader extraordinaire.
“Industrial production increased 0.4 percent in September and 2.9 percent at an annual rate in the third quarter. In September, manufacturing output rose 0.4 percent after advancing a similar amount in the previous month.” Release at...
https://www.federalreserve.gov/releases/g17/current/default.htm

https://www.nahb.org/news-and-economics/housing-economics/indices/housing-market-index
“Builder sentiment fell for the ninth consecutive month in September as elevated interest rates, persistent building material supply chain disruptions, and high home prices continue to impact housing affordability, according to the NAHB.” Story at...
https://www.builderonline.com/data-analysis/nahb-wells-fargo-housing-market-index-falls-for-ninth-consecutive-month_o
-Tuesday the S&P 500 rose about 1.1% to 3720.
-VIX dipped about 3% to 30.5. (That’s still not much drop given the big move up in the S&P 500. The VIX crowd remains skeptical, although to be fair, a high VIX suggests big moves in price in EITHER direction.)
-The yield on the 10-year Treasury was still 4.013%.
-Drop from Top: 22.4% as of today. 25.4% max (on a closing basis).
-Trading Days since Top: 199-days.
The S&P 500 is 10.4% Below its 200-dMA & 5% Below its 50-dMA.
*I won’t call the correction over until the S&P 500 makes a new-high; however, evidence suggests the bottom was / is in the 3600 area and I am fully invested with a higher percentage of stocks than normal.
XLI – Industrial ETF
QLD – 2x Nas 100
DDM – 2x Dow 30
XLK – Technology ETF
CVX – (I may hold this as a long-term position. I already owned a small position in CVX.)
SPY – S&P 500 (I may hold this as a long-term position.)
IWM - Russell 2000. (I may hold this as a long-term position.)
I got the volume signal I was looking for – up-volume was 83% today. That’s a very bullish sign since it follows the 93% up-volume day yesterday. As noted earlier, “In approximately half the cases in the past 69 years, the 90% Upside Day, or the back-to-back 80% Upside Days, which signaled a major market reversal, occurred within five trading days or less of the market low.” - Identifying Bear Market Bottoms - Lowry Research. The bottom was 4 days ago. We also note that since my buy signal of 27 September, there have been four 90% up-volume days and two back-to-back 80%+ up-volume days. That’s strongly suggesting a durable rally.
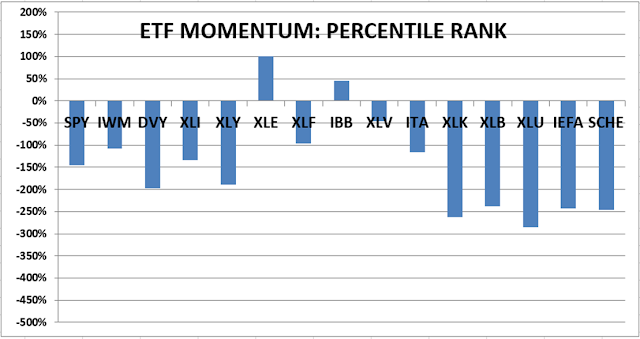
TODAY’S RANKING OF 15 ETFs (Ranked Daily)
ETF ranking follows:
The top ranked ETF receives 100%. The rest are then ranked based on their momentum relative to the leading ETF.
#1. XLE #2. IBB #3. XLV
http://navigatethestockmarket.blogspot.com/p/exchange-traded-funds-etf-ranking.html
DOW 30 momentum ranking follows:
#1. AMGN #2. MRK #3. CVX

The top ranked Stock receives 100%. The rest are then ranked based on their momentum relative to the leading Stock.
For more details, see NTSM Page at…
https://navigatethestockmarket.blogspot.com/p/a-system-for-trading-dow-30-stocks-my_8.html

(Market Internals are a decent trend-following analysis of current market action, but should not be used alone for short term trading. They are most useful when they diverge from the Index.)