“Trade what you see; not what you think.” – The Old Fool, Richard McCranie, trader extraordinaire.
"The US LEI remained on a downward trajectory, but its rate of decline moderated slightly in January... Among the leading indicators, deteriorating manufacturing new orders, consumers' expectations of business conditions, and credit conditions more than offset strengths in labor markets and stock prices to drive the index lower in the month. The contribution of the yield spread component of the LEI also turned negative in the last two months, which is often a signal of recession to come. While the LEI continues to signal recession in the near term, indicators related to the labor market—including employment and personal income—remain robust so far. Nonetheless, The Conference Board still expects high inflation, rising interest rates, and contracting consumer spending to tip the US economy into recession in 2023." Press release at...
https://www.prnewswire.com/news-releases/the-conference-board-leading-economic-index-lei-for-the-us-declined-again-in-january-301749725.html
-Friday the S&P 500 fell about 0.3% to 4079.
-VIX slipped up about 1% to 20.02.
-The yield on the 10-year Treasury dipped to 3.820%.
-Drop from Top: 13.5% as of today. 25.4% max (on a closing basis).
-Trading Days since Top: 283-days.
The S&P 500 is 3.4% ABOVE its 200-dMA & 2.2% ABOVE its 50-dMA.
*I won’t call the correction over until the S&P 500 makes a new-high; however, evidence suggests the bottom was in the 3600 area.
XLK – Technology ETF.
XLE – Energy Sector ETF. It hasn’t been doing much recently, but Russia is cutting production and that should help the sector. We have a good dividend in the meantime.
BA – (Boeing) I am late on this one, but we’ll see.
XLY - Consumer Discretionary ETF.
The percentage of issues advancing on the NYSE over the last 100-days is solidly bullish. The chart below covers the Bear Market. This is just another indicator that suggests the bear market is over.

-The 50-dMA percentage of issues advancing on the NYSE (Breadth) is above 50%.
-The 100-dMA percentage of issues advancing on the NYSE (Breadth) is above 50%.
-There was a Zweig Breadth Thrust 12 January. That’s a rare, very-bullish sign.
-Long-term new-high/new-low data.
-The short-term, 10-dayEMA, Fosback Hi-Low Logic Index is bullish.
-The long-term, 50-dEMA, Fosback Hi-Low Logic Index is bullish.
-Slope of the 40-dMA of New-highs is rising.
-On average, the size of up-moves has been larger than the size of down-moves over the last month.
-The graph of the 100-day Count (the 100-day sum of up-days) is rising.
-The 5-10-20 Timer System is BUY; the 5-dEMA and 10-dEMA are both above the 20-dEMA.
-90% up-volume days - the last one was 31 Jan. and before that, 30 November. That’s pretty far apart, but I’ll still put this in the bullish column. We have not seen a 90% down-volume day since the two 90% up-volume days.
-XLI-ETF (Cyclical Industrials) is outperforming the S&P 500. The Long-term value is turning down sharply, but the short-term value is up sharply. Let’s call it Bullish.
-S&P 500 is outperforming Utilities (XLU-ETF).
-There was a Distribution Day 9 Feb, however, it’s only 1 since the last Follow-thru day.
-There have only been 3 Statistically-Significant days (big moves in price-volume) in the last 15-days.
-Bollinger Bands.
-Sentiment.
-Overbought/Oversold Index (Advance/Decline Ratio).
-Issues advancing on the NYSE (Breadth) compared to the S&P 500.
-There have been 4 up-days over the last 10 sessions – neutral.
-There have been 10 up-days over the last 20 sessions - neutral.
-RSI
-The 50-dMA percentage of issues advancing on the NYSE (Breadth) has been above 50%, for 3 days in a row ending the “correction-now” signal.
-The Calm-before-the-Storm/Panic Indicator flashed a panic-buying signal 10 November - expired.
-VIX indicator.
-The S&P 500 is 3.4% above its 200-dMA. (Bear indicator is 12% above the 200-day.)
-There was a Hindenburg Omen signal 8 April – expired.
-2.8% of all issues traded on the NYSE made new, 52-week highs when the S&P 500 made a new all-time-high, 3 January 2022. (There is no bullish signal for this indicator.) This indicated that the advance was too narrow and a correction was likely to be >10%. It proved correct, but is now Expired
-The 52-week, New-high/new-low ratio improved by 3.5 standard deviations. More simply, the spread between new-highs and new-lows improved by 716 on 14 October. That’s a solid bottom sign at a retest. – Expired.
-13 & 21 Oct were Bullish Outside Reversal Days with no Bearish Outside Reversal days since then - expired.
-45.3% of the 15-ETFs that I track have been up over the last 10-days. That’s close enough to 50% to be neutral.
-The 10-dMA percentage of issues advancing on the NYSE (Breadth) is below 50%.
-The smoothed advancing volume on the NYSE is falling.
-MACD of the percentage of issues advancing on the NYSE (breadth) made a bearish crossover 6 Feb.
-Smoothed Buying Pressure minus Selling Pressure is falling.
-MACD of S&P 500 price made a bearish crossover 10 Feb.
-My Money Trend indicator is falling.
-Short-term new-high/new-low data.
-McClellan Oscillator.
-The Smart Money (late-day action) is bearish.
-The 5-day EMA is below the 10-day EMA so short-term momentum is bearish.
BEST ETFs - MOMENTUM ANALYSIS:
TODAY’S RANKING OF 15 ETFs (Ranked Daily)
ETF ranking follows:

The top ranked ETF receives 100%. The rest are then ranked based on their momentum relative to the leading ETF.
*For additional background on the ETF ranking system see NTSM Page at…
http://navigatethestockmarket.blogspot.com/p/exchange-traded-funds-etf-ranking.html
DOW 30 momentum ranking follows:
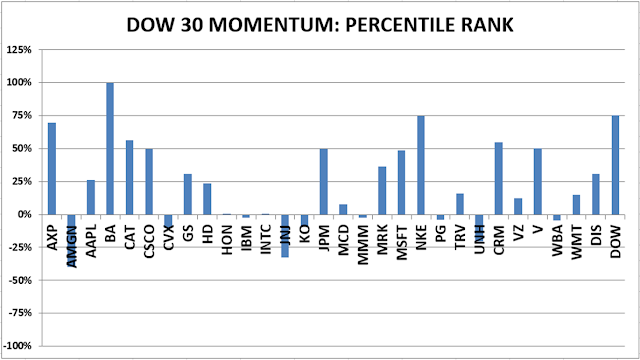
The top ranked Stock receives 100%. The rest are then ranked based on their momentum relative to the leading Stock.
For more details, see NTSM Page at…
https://navigatethestockmarket.blogspot.com/p/a-system-for-trading-dow-30-stocks-my_8.html
