
https://michaelpramirez.com/index.html
My cmt: I remember when Nikita Khruschev pounded his shoe on a desk at the UN and screamed, “We will bury you.” America First devotees should consider that standing up to Russia is America First. Supporting Ukraine also sends a message to China regarding their ambitions in Taiwan.
“The headline PCE rose 5.4% in January. That's up from a 5.3% gain in December but still well below its 2022 high of a 7% increase in June. The January PCE reading came in well above economist estimates of 4.9%. Core PCE inflation, which excludes volatile food and energy prices, was up 4.7% in January, above economist estimates of 4.3%.” Story at...
https://www.benzinga.com/analyst-ratings/analyst-color/23/02/31049404/big-upside-surprise-experts-react-to-4-7-core-pce-inflation-as-interest-rate-expect
“Real personal spending shot higher in January, and solid growth in discretionary services suggests continued consumer resilience...Real personal spending got a lift again to start the year, and in jumping 1.1% in January...” Story at...
https://www.fxstreet.com/analysis/january-personal-income-and-spending-signs-of-resilience-beneath-volatility-202302241509
“Sales of new US single-family homes jumped to a 10-month high in January as prices declined, but a resurgence in mortgage rates could slow a much anticipated housing market turnaround. New home sales increased 7.2%...” Story at...
https://nypost.com/2023/02/24/january-new-home-sales-jump-to-10-month-high-as-prices-fall/
-Friday the S&P 500 fell about 1.1% to 3970.
-VIX rose about 3% to 21.67.
-The yield on the 10-year Treasury rose to 3.953%.
-Drop from Top: 17.2% as of today. 25.4% max (on a closing basis).
-Trading Days since Top: 283-days.
The S&P 500 is 0.8% ABOVE its 200-dMA & 0.3% BELOW its 50-dMA.
*I won’t call the correction over until the S&P 500 makes a new-high; however, evidence suggests the bottom was in the 3600 area.
SSO – 2x S&P 500 (added today)
XLE – Energy Sector ETF. It hasn’t been doing much recently, but Russia is cutting production and that should help the sector. We have a good dividend in the meantime.
BA – (Boeing) I am late on this one, but we’ll see.
XLY - Consumer Discretionary ETF.
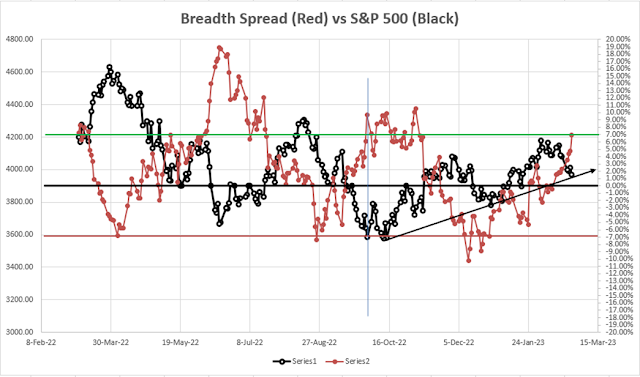
The S&P 500 broke below its 50-dMA, bounced off the 200-dMA and closed just above its lower trend line (black sloping line) in the chart below. In addition, my Breadth Spread (comparing breadth to the S&P 500 in the below chart), Bollinger Bands & RSI are all very close to giving a buy signal. (They were all buy when I checked earlier in the day and I thought they all were at the close - oops.) I did buy SSO (2x S&P 500) near the close.
“Friday there were 5 bull indicators:
-The 10-dMA % of issues advancing on the NYSE (Breadth) is above 50%.
-Short-term new-high/new-low data is rising.
-The 5-10-20 Timer System is BUY; the 5-dEMA and 10-dEMA are both ABOVE the 20-dEMA.
Today [Monday, 20 December 2021], none of those indicators are bullish. It looks like today’s count would be 21 bear and zero bull. That’s the worst count since I started keeping these numbers a couple years ago.” As you might imagine, I reduced stock holdings 20 December 2021. Enough about the past...
The Friday rundown of indicators was a little more bearish than last week (now 11-bear and 9-bull), but not far from neutral. (These indicators tend to be both long-term and short-term, so they are different than the 20 that I report on daily.)
-The smoothed advancing volume on the NYSE is falling.
-The 50-dMA percentage of issues advancing on the NYSE (Breadth) is above 50%.
-The 100-dMA percentage of issues advancing on the NYSE (Breadth) is above 50%.
-Long-term new-high/new-low data.
-The long-term, 50-dEMA, Fosback Hi-Low Logic Index is bullish.
-On average, the size of up-moves has been larger than the size of down-moves over the last month.
-90% up-volume days - the last one was 31 Jan. and before that, 30 November. That’s pretty far apart, but I’ll still put this in the bullish column. We have not seen a 90% down-volume day since the 2 up-volume days.
-XLI-ETF (Cyclical Industrials) is outperforming the S&P 500. The Long-term value is turning down sharply, but the short-term value is up today. Let’s call it Bullish.
-S&P 500 is outperforming Utilities (XLU-ETF).
-Bollinger Bands. (Very close to bullish.)
-RSI (Very close to bullish.)
-Issues advancing on the NYSE (Breadth) compared to the S&P 500. – Very close to a bullish indication.
-There was a Distribution Day 9 & 21 Feb, however, it’s only 2 since the last Follow-thru day.
-There have only been 2 Statistically-Significant days (big moves in price-volume) in the last 15-days.
-Sentiment.
-The short-term, 10-dayEMA, Fosback Hi-Low Logic Index is neutral.
-Overbought/Oversold Index (Advance/Decline Ratio).
-There was a Zweig Breadth Thrust 12 January. That’s a rare, very-bullish sign. - Expired
-There have been 4 up-days over the last 10 sessions – neutral.
-There have been 9 up-days over the last 20 sessions - neutral.
-The graph of the 100-day Count (the 100-day sum of up-days) is flat.
-The 50-dMA percentage of issues advancing on the NYSE (Breadth) has been above 50%, for 3 days in a row ending the “correction-now” signal.
-The Calm-before-the-Storm/Panic Indicator flashed a panic-buying signal 10 November - expired.
-VIX indicator.
-The S&P 500 is 0.8% above its 200-dMA. (Bear indicator is 12% above the 200-day.)
-There was a Hindenburg Omen signal 8 April 2022 – expired.
-2.8% of all issues traded on the NYSE made new, 52-week highs when the S&P 500 made a new all-time-high, 3 January 2022. (There is no bullish signal for this indicator.) This indicated that the advance was too narrow and a correction was likely to be >10%. It proved correct, but is now Expired
-The 52-week, New-high/new-low ratio improved by 3.5 standard deviations. More simply, the spread between new-highs and new-lows improved by 716 on 14 October. That’s a solid bottom sign at a retest. – Expired.
-13 & 21 Oct were Bullish Outside Reversal Days with no Bearish Outside Reversal days since then - expired.
-46% of the 15-ETFs that I track have been up over the last 10-days. Neutral.
-The 10-dMA percentage of issues advancing on the NYSE (Breadth) is below 50%.
-MACD of the percentage of issues advancing on the NYSE (breadth) made a bearish crossover 6 Feb.
-Smoothed Buying Pressure minus Selling Pressure is falling.
-MACD of S&P 500 price made a bearish crossover 10 Feb.
-My Money Trend indicator is falling.
-Short-term new-high/new-low data.
-McClellan Oscillator.
-Slope of the 40-dMA of New-highs is falling.
-The Smart Money (late-day action) is bearish.
-The 5-10-20 Timer System is SELL; the 5-dEMA and 10-dEMA are both below the 20-dEMA.
-The 5-day EMA is below the 10-day EMA so short-term momentum is bearish.
ETF - MOMENTUM ANALYSIS:
TODAY’S RANKING OF 15 ETFs (Ranked Daily)
ETF ranking follows:

The top ranked ETF receives 100%. The rest are then ranked based on their momentum relative to the leading ETF.
*For additional background on the ETF ranking system see NTSM Page at…
http://navigatethestockmarket.blogspot.com/p/exchange-traded-funds-etf-ranking.html
DOW 30 momentum ranking follows:

The top ranked Stock receives 100%. The rest are then ranked based on their momentum relative to the leading Stock.
For more details, see NTSM Page at…
https://navigatethestockmarket.blogspot.com/p/a-system-for-trading-dow-30-stocks-my_8.html
