“The number of Americans filing for unemployment benefits
fell to near a 44-year low last week, pointing to further tightening of the
labor market even as economic growth appears to have remained moderate in the
first quarter…Initial claims for state unemployment benefits dropped 19,000 to
a seasonally adjusted 223,000 for the week ended Feb. 25…” Story at…
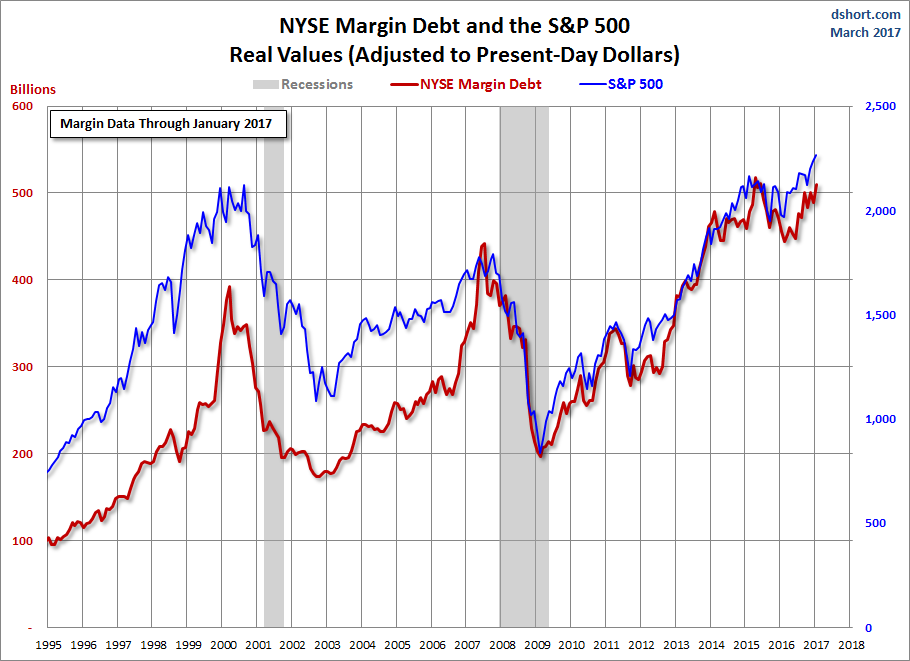
MARGIN DEBT WARNING OF A TOP – AGAIN (dShort.com)
“The NYSE has released new data for margin debt, now
available through January. The latest debt level is up 4.9% month-over-month.
The current level is at its record high. Note the inflation-adjusted version is
just off its record high in April 2015. The January data gives us an additional
sense of investor behavior since the start of the new administration.” – Jill
Mislinsky.
 Charts, commentary and analysis at…
INVESTORS SELLING STOCKS (Financial Sense)
“US investors sold stocks for the second consecutive week
last week after having been net buyers for the prior 14 weeks since the
election, that’s according to Bank of America Merrill Lynch’s weekly client
flow trends report.” Story at…
MARKET REPORT / ANALYSIS
-Thursday the S&P 500 was down about 0.6% to 2382.
-VIX dropped about 6% to 11.81. (I can’t explain that.)
-The yield on the 10-year Treasury rose to 2.479%. (The
Bond Ghouls were selling; I guess the rate-hike fears are worrying them.)
The sum of 16-indicators was -4 today and the longer
trend remains down. Money Trend is pointing down. It looks like the Pros are
selling based on Late-day action that has been trending down on average over
the last month; late day selling was yooouuuge today.
Volume picked up and was about 5% over the monthly normal
today so there is some conviction in this downturn. (Light volume would have
looked squirrely.) It looks like the long-awaited correction may have finally
arrived. The buy-the-dippers should be moving in soon. The early buyers may be disappointed this
time; I’m guessing a 5-6% drop is in the works.
CURRENT RANKING OF 15 ETFs (Ranked Daily)
Every one of the ETFs I track was down on the day except
for Utilities. This just shows how the
active traders react to a downturn. They took profits after hours.

The top ranked ETF receives 100%. The rest are then ranked
based on their momentum relative to the leading ETF. While momentum isn’t stock performance per
se, momentum is closely related to stock performance. For example, over the 4-months
from Oct thru mid-February 2016, the number-1 ranked Financials (XLF) outperformed
the S&P 500 by nearly 20%.
*For additional background on the ETF ranking system see
NTSM Page at…
I would avoid iEAFE (Europe and Far East) and SCHE
(emerging markets); currently their 120-dMAs are declining.
Recommended ETF Portfolio of top 3:
1. Financial Select Sector SPDR (XLF)
2. iShares U.S. Aerospace & Defense (ITA)
3. Technology Select Sector SPDR ETF (XLK)
XLI was slightly ahead of the XLK, but not enough to
change the recommendation. Further, if
there is a correction, XLI is likely to be among the worst performers.
I have not yet established a position based on the ETF
Ranking; I am waiting for a better entry point.
Energy (XLE) was in 13th place today vs 3rd
place in January. If Energy continues to slide the S&P 500 is likely to
follow.
SHORT-TERM TRADING PORTFOLIO - 2017 (Small-% of the
total portfolio)
Rydex 2x Short S&P 500 (RYTPX): Established 6 Dec.
2x Short S&P 500 (SDS): Established 16 Dec.
Long Volatility ETN (VXX): Established 6 Jan 2017.
NET:
Now I wish I had tightened trading rules sooner. I am
underwater again!
-“In a bull market, you can only be long or
neutral.” – D. Gartman
-“The best policy
is to avoid shorting unless a major bear market is underway and downside
momentum has been thoroughly established. Even then, your timing must sometimes
be perfect. In a bull market the trend is truly your friend, and trading
against the grain is usually a fool's errand.” – Clif Droke.
“There are two kinds of forecasters. Those who
don’t know, and those who don’t know they don’t know.”- John Kenneth Galbraith.
THURSDAY MARKET INTERNALS (NYSE DATA)
Market Internals
declined to Negative on the market.

Market Internals are a decent trend-following analysis of
current market action, but should not be used alone for short term trading.
They are usually right, but they are often late. They are most useful when they diverge from
the Index. In 2014, using these
internals alone would have made a 9% return vs. 13% for the S&P 500 (in on
Positive, out on Negative – no shorting).
LONG TERM INDICATOR
Thursday, Price was positive; Sentiment Volume & VIX
indicators were neutral.

MY INVESTED STOCK POSITION:
TSP (RETIREMENT ACCOUNT – GOV EMPLOYEES) ALLOCATION
I reduced stock allocation to 25% stocks in the
S&P 500 Index fund (C-Fund) Wednesday, 1 March 2017 in my long-term
accounts.
Remainder is 75% G-Fund (Government securities). This is a conservative retiree
allocation based mostly on short-term signals.