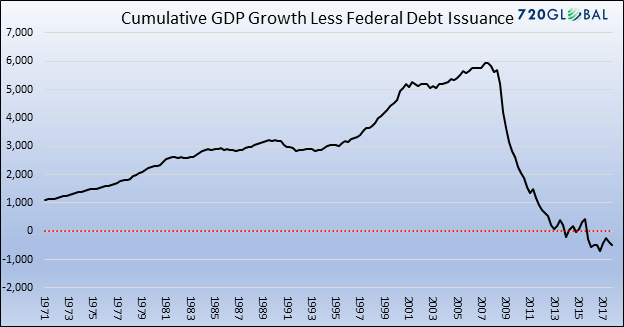
“How much longer can we continue juicing economic growth
like this? The U.S. federal debt recently hit $20 trillion [WSJ reported over
the weekend that it is now 21-trillion] and is expected to hit $30 trillion by
2028. Despite what Modern Monetary Theorists (MMTers), Keynesians, and similar
schools of thought claim, common sense dictates that the endgame is not far
off.” Jesse Columbo. Commentary at…
MARKET REPORT / ANALYSIS
-Monday the S&P 500 was DOWN about 1.4% to 2712.
-VIX was UP about 20% to 19.02.
-The yield on the 10-year Treasury rose to 2.857%. (Bonds
and stocks both sold off.)
My sum of 17 Indicators dropped from +3 to -3. but the 10-day version jumped up again (from +12
to +16) reinforcing that conditions now are much better than they were not long
ago.
We saw some buying late in the day, but late-day action
over the longer term has been neutral. Late day action is thought to indicate
the sentiment of the Pros.
Overall though, todays’ action was worrisome.
The S&P 500 broke the 50-dMA and my lower trend line.
Both are significant and raise the likelihood that the Index will retest the prior
low of 2558 last seen on 8 Feb. Today was a statistically-significant, down-day.
That just means that the price-volume move down exceeded statistical parameters
that I track. The stats show that about 60% of the time a statistically
significant move down will be followed by an up-day the next day. This drop also
makes another higher low, the third one in this correction. Volume has dropped
on each higher-low suggesting fear has dropped as the market has experienced
these “panic” days. Today, the volume was 75% lower than the last higher low on
1 March. Could this mean that the markets will make a sustained move up from
here. It could but, it is certainly not an all clear for the correction.
As I have written a couple of times, it would take a
retest of the prior low to give us the confidence to make a call on the status
of the correction.
For now, I will see if we get the expected bounce
tomorrow. Currently, I am not seeing a
slew of negative signs that would warrant selling; it could happen quickly
though, so I’ll pay attention.
TODAY’S RANKING OF
15 ETFs (Ranked Daily)

The top ranked ETF receives 100%. The rest are then
ranked based on their momentum relative to the leading ETF. While momentum isn’t stock performance per
se, momentum is closely related to stock performance. For example, over the 4-months
from Oct thru mid-February 2016, the number 1 ranked Financials (XLF) outperformed
the S&P 500 by nearly 20%. In 2017 Technology (XLK) was ranked in the top 3
Momentum Plays for 52% of all trading days in 2017 (if I counted correctly.)
XLK was up 35% on the year while the S&P 500 was up 18%.
*For additional background on the ETF ranking system see
NTSM Page at…
TODAY’S RANKING OF THE DOW 30 STOCKS (Ranked Daily)

The top ranked stock receives 100%. The rest are then
ranked based on their momentum relative to the leading stock.
*I rank the Dow 30 similarly to the ETF ranking system.
For more details, see NTSM Page at…
MONDAY MARKET INTERNALS (NYSE DATA)
Market Internals slipped
to Neutral on the market.
Market Internals are a decent trend-following analysis of
current market action but should not be used alone for short term trading. They
are usually right, but they are often late.
They are most useful when they diverge from the Index. In 2014, using these internals alone would
have made a 9% return vs. 13% for the S&P 500 (in on Positive, out on
Negative – no shorting).
LONG TERM INDICATOR
Monday, the VIX indicator
was negative; Price was positive; Sentiment and Volume were neutral.
MY INVESTED STOCK POSITION:
TSP (RETIREMENT ACCOUNT – GOV EMPLOYEES) ALLOCATION
27 February, I
increased stock holdings from 40% to 50% with the remainder in a mix of stocks
and (mostly short-term) bonds. (A comparable TSP allocation would be 50% in the
S&P 500 Index fund (C-Fund) with the remainder 50% G-Fund (Government
securities). This is a conservative retiree position.