“U.S. consumer confidence surged to near an 18-year high
in August, as households remained upbeat on the labor market, pointing to strong
consumer spending that should help to sustain the economy for the remainder of
the year.” Story at…
CFNAI (Chicago FED)
“Led by slower growth in production-related indicators,
the Chicago Fed National Activity Index (CFNAI) declined to +0.13 in July from
+0.48 in June. Three of the four broad categories of indicators that make up
the index decreased from June, but three of the four categories made positive
contributions to the index in July. The index’s three-month moving average,
CFNAI-MA3, moved down to +0.05 in July from +0.20 in June.” Press release at…
POWELL FED JACKSON HOLE SPEECH (ZeroHedge)
“Fed Chair Jay Powell spent 5 paragraphs of his Jackson Hole
speech on Friday explaining why Alan Greenspan was right to keep rates low from
1995 to 1999. If you want to know why US stocks rallied to fresh highs on
his talk, that’s pretty much all you need to know.” Story at…
WHY STOCKS HIT A RECORD (Real Investment Advice)
“As long as U.S. monetary conditions are still very
loose, there will be a general tendency for the stock market bubble to continue
inflating, which means that the final unwind will be even worse. The Fed will
likely continue hiking interest rates until the real Fed funds rate is neutral
or positive again, which will then contribute to the bursting of the stock
market bubble.” Commentary at…
STUDENT LOANS BITE THE ECONOMY (Bloomberg)
“Potential homeowners are being thwarted by the costs of
paying off bills for higher education. Student loans are now the second-largest
category of household debt in America, topping $1.4 trillion and trailing
only mortgages at $9 trillion.” Story at…
My cmt: Free college education would blunt the economy
too - someone has to pay. The problem is that the colleges have been unconstrained
in their spending and are passing on the costs.
MARKET REPORT / ANALYSIS
-Tuesday the S&P 500 was little changed at 2898.
-VIX rose about 3% to 12.50.
-The yield on the 10-year Treasury rose to 2.880% as of
this post.
At the high yesterday only 3.9% of stocks made new
all-time highs. That’s a low number that
shows advance has been narrow in this recent run up. If the markets were healthier, we would see
more participation, i.e. more stocks making new-highs at the all-time high. In the past this observation hasn’t resulted
in much of anything important. I had to
go all the way back to 2015 to find a point when this stat was important. Then,
when only 2.3% of stocks made new-highs at the all-time high on 21 May, it immediately
preceded a 12% correction. FYI, the average is 6% of stocks making new-highs at
the all-time high (looking at the 15 major tops) going all the way back to the
all-time high of 3 Sept. 1929. You’d think this was an important stat, but it
doesn’t seem to correlate well. I read a research paper a few years ago that
touted this stat. Sorry, but it hasn’t
worked for me.
Currently, my daily sum of 17 Indicators slipped from +6 to
+4 (a positive number is bullish) while the 10-day smoothed version that
negates the daily fluctuations improved from +19 to +30 indicating that
conditions are much better than 2-weeks ago.
Things look bullish except that the Bearish signs are the
same as yesterday: Bollinger Bands and the Overbought/Oversold Ratio both remain
oversold. 7 out of the last 10-days have been up and that’s a cautionary
number. So far, RSI remains neutral. If we get more negative signs the most
likely move would be a 3-5% pullback.
I remain fully invested.
MOMENTUM ANALYSIS:
TODAY’S RANKING OF
15 ETFs (Ranked Daily)

The top ranked ETF receives 100%. The rest are then
ranked based on their momentum relative to the leading ETF. While momentum isn’t stock performance per
se, momentum is closely related to stock performance. For example, over the
4-months from Oct thru mid-February 2016, the number 1 ranked Financials (XLF)
outperformed the S&P 500 by nearly 20%. In 2017 Technology (XLK) was ranked
in the top 3 Momentum Plays for 52% of all trading days in 2017 (if I counted correctly.)
XLK was up 35% on the year while the S&P 500 was up 18%.
*For additional background on the ETF ranking system see
NTSM Page at…
TODAY’S RANKING OF THE DOW 30 STOCKS (Ranked Daily)
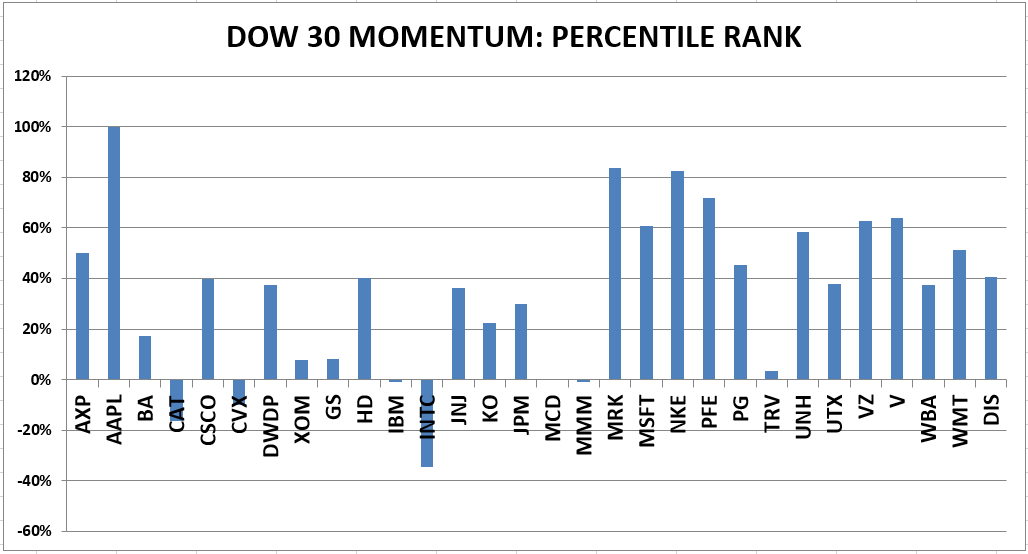
The top ranked stock receives 100%. The rest are then
ranked based on their momentum relative to the leading stock.
*I rank the Dow 30 similarly to the ETF ranking system.
For more details, see NTSM Page at…
TUESDAY MARKET INTERNALS (NYSE DATA)
Market Internals
remained POSITIVE on the market.
Market Internals are a decent trend-following analysis of
current market action but should not be used alone for short term trading. They
are usually right, but they are often late.
They are most useful when they diverge from the Index. In 2014, using these internals alone would
have made a 9% return vs. 13% for the S&P 500 (in on Positive, out on
Negative – no shorting).
I am now 50% invested in stocks. For me, fully invested
is a balanced 50% stock portfolio. As a retiree, this is a position with which
I am comfortable unless I am in full defense mode or feeling especially
optimistic.
INTERMEDIATE / LONG-TERM INDICATOR
Intermediate/Long-Term
Indicator: Tuesday, the Price indicator was positive; Volume,VIX &
Sentiment were neutral. Overall this is still a NEUTRAL indication.