“The number of Americans filing for unemployment benefits
fell to a near 49-year low last week, pointing to sustained labor market
strength, which should continue to underpin economic growth.” Story at…
FACTORY ORDERS (Reuters)
"New orders for U.S.-made goods recorded their biggest
increase in nearly a year in August, boosted by a surge in demand for aircraft,
but signs of weakness in business spending on equipment suggested that the
manufacturing sector could be slowing.” Story at…
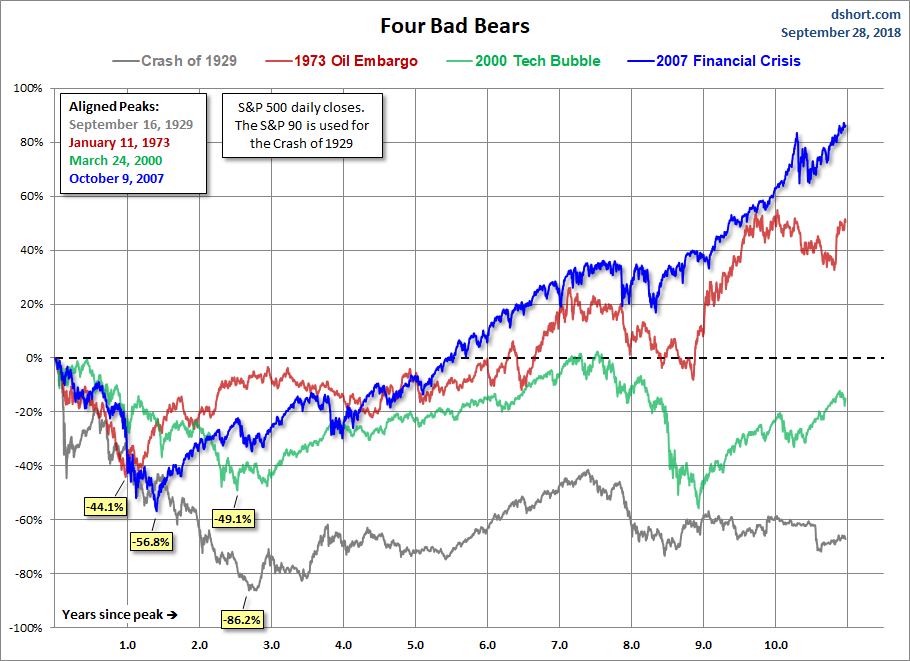
A COMPARISON OF BEAR MARKET RECOVERIES (Advisor Perspectives)
This recovery is way ahead…

Commentary and analysis at…
TEN HINDENBURGS SO FAR (McClellan Financial Publications)

“The stock market has been doing something peculiar
lately. In an obvious uptrend, we are starting to see an increasing
number of NYSE-listed issues making new 52-week lows. When the number of
New Highs (NH) and New Lows (NL) both exceed a certain threshold on the same
day, coupled with some other criteria, that is known as a Hindenburg
Omen. And what we are seeing lately is a very large cluster of them in a
short time span, a behavior that tends to have more importance than a lone
signal all by itself…Perhaps it is a big sign of trouble, or perhaps the
transition to the period of positive seasonality in October will act as a
stronger force to keep the uptrend going.” - Tom McClellan.
My cmt: As Tom McClellan noted in his piece, “… some
analysts use different criteria from what Miekka [the originator of this
indicator] specified, and so you may find differing accounts about the number
of Hindenburg Omen (HO) signals…” My method has not yet signaled a Hindenburg
Omen recently. The last one was in January 2015. Frankly, I’d rather not see one.
MARKET REPORT / ANALYSIS
-Thursday the S&P 500 dropped about 0.8% to 2902.
-VIX jumped about 22% to 14.22.
-The yield on the 10-year Treasury was unchanged at 3.188%
as of 4:59PM.
In spite of the down day, there are some bullish signs:
Cyclical Industrial stocks (XLI-ETF) are outperforming
the S&P 500 and the curve is still headed up so the trend has not changed.
Utilities (XLU-ETF) are outperforming the Index, but the curve is falling
suggesting that Utilities may not outperform much longer. Those are both bullish signs if the trends
continue.
Only 7 of the last 10-days have been up and that suggests
we’re closer to a bottom than a top.
Thursday was a statistically-significant, down-day. That
just means that the price-volume move down exceeded statistical parameters that
I track. The stats show that about 60% of the time a statistically significant
move down will be followed by an up-day the next day.
The S&P 500 is about 1% above its 59-day moving
average (50-dMA) of 2876; and about 5% above its 200-dMA. The lower Bollinger
Band (2-std deviations below the Index) is 2873. Thus, there is a lot of support
at about the 2875 level. We will get worried if the Index drops much below that
level.
Currently, my daily sum of 17 Indicators slipped from -1
to -4 (a positive number is bullish; negatives are bearish) while the 10-day
smoothed version that negates the daily fluctuations dropped from -13 to -23
indicating that conditions are worse than 2-weeks ago.
New 52-week lows were again much higher than new 52-week
highs. The last time the spread was as bad as today (new-low minus new-highs
were -389) was near the bottom of the 10% correction in February 2018. (There
were 2 bottoms at 2581 early this year so this looks a lot like yesterday’s
comment on this subject.) I suppose one could argue that the spread suggests
that we’re closer to the bottom than the top, especially given other bullish
signs I noted above.
We still have a significant warning from the Fosback
Hi-Low Logic indicator and this indicator is based on the fact that new 52-week
highs and new 52-week lows should not both be high numbers at the same time. As
of yet, we do not have a Hindenburg Omen.
I remain a very cautious Bull, fully invested. We’ll just
have to see how rough spot develops, if it develops.
MOMENTUM ANALYSIS:
TODAY’S RANKING OF
15 ETFs (Ranked Daily)

The top ranked ETF receives 100%. The rest are then
ranked based on their momentum relative to the leading ETF. While momentum isn’t stock performance per
se, momentum is closely related to stock performance. For example, over the
4-months from Oct thru mid-February 2016, the number 1 ranked Financials (XLF)
outperformed the S&P 500 by nearly 20%. In 2017 Technology (XLK) was ranked
in the top 3 Momentum Plays for 52% of all trading days in 2017 (if I counted
correctly.) XLK was up 35% on the year while the S&P 500 was up 18%.
*For additional background on the ETF ranking system see
NTSM Page at…
TODAY’S RANKING OF THE DOW 30 STOCKS (Ranked Daily)

The top ranked stock receives 100%. The rest are then
ranked based on their momentum relative to the leading stock.
*I rank the Dow 30 similarly to the ETF ranking system.
For more details, see NTSM Page at…
THURSDAY MARKET INTERNALS (NYSE DATA)
Market Internals dropped
to Negative on the market.
Market Internals are a decent trend-following analysis of
current market action but should not be used alone for short term trading. They
are usually right, but they are often late.
They are most useful when they diverge from the Index. In 2014, using these internals alone would
have made a 9% return vs. 13% for the S&P 500 (in on Positive, out on
Negative – no shorting).
I am now 50% invested in stocks. For me, fully invested
is a balanced 50% stock portfolio. As a retiree, this is a position with which
I am comfortable unless I am in full defense mode or feeling especially
optimistic.
INTERMEDIATE / LONG-TERM INDICATOR
Thursday, the Price
indicator was positive; Sentiment, Volume & VIX were neutral. Overall this
is a NEUTRAL indication.