“U.S. hiring cooled in September by more than forecast,
wage gains eased slightly and the jobless rate fell to a 48-year low,
illustrating a tight labor market as well as the impact of Hurricane Florence. Nonfarm
payrolls rose 134,000 after a 270,000 gain the prior month…” Story at…
My cmt: The unemployment rate dropped to 3.7%. An MBA
friend of mine once told me that he was taught the unemployment rate couldn’t
drop below 4%. Hurricane Florence may have given us some bad numbers so it’s
hard to place any significance to the drop in hiring.
1929 AND THE CURRENT MARKET – ROBERT SHILLER
“It's a comparison no one wants to hear — that this stock
market bears striking similarities to that of 1929. The observation is coming
from Nobel Prize-winning economist Robert Shiller, who's been arguing valuations
are extremely expensive…Shiller may see red flags, but he isn't ruling out a
market that continues to churn out fresh records for months, if not years.
"I wouldn't call it healthy, I'd call it obese. But you know, some of
these obese people live to be 100 years, so you never know," said
Shiller.” Story at…
MARKET REPORT / ANALYSIS
-Friday the S&P 500 dropped about 0.6% to 2886.
-VIX rose about 5% to 14.93.
-The yield on the 10-year Treasury was up to 3.23% as of 5:01PM.
Yesterday’s selloff was on volume that was about 4% above
the monthly average; today’s was at the monthly average. Bottom line here is
that there has not been any panic and selling is not accelerating.
Only 3 of the last 10-days have been up and that suggests
we’re closer to a bottom than a top. (I had a typo yesterday. Most days have been down recently.)
The overbought/oversold ratio is “oversold.” Only 41.7%
of stocks o the NYSE have advanced over the last 10-days.
Again, today (Friday) was a statistically-significant,
down-day. That just means that the price-volume move down exceeded statistical
parameters that I track. The stats show that about 60% of the time a
statistically significant move down will be followed by an up-day the next day.
The S&P 500 is about 0.3% above its 50-day moving
average (50-dMA) of 2876; and about 4.4% above its 200-dMA. Today, the lower
Bollinger Band (2-std deviations below the Index) is 2876. Thus, there is a lot
of support at about the 2875 level. We will get worried if the Index drops much
below that level. With the close at 2886 we hope we won’t see too much selling.
If it does we’ll be watching the 200-dMA, now at 2763.
Currently, my daily sum of 17 Indicators slipped from -4
to -5 (a positive number is bullish; negatives are bearish) while the 10-day
smoothed version that negates the daily fluctuations dropped from -23 to -35
indicating that conditions are worse than 2-weeks ago.
New 52-week lows were again much higher than new 52-week
highs with the spread of new-highs minus new-lows was -373. That’s a number
where we often see bottoms.
Bollinger Bands are showing a squeeze (upper and lower
Bollinger Bands are close together). This indicates we may see a breakout soon,
up or down. I think the most likely direction is up, given that RSI is in neutral
territory and the Index is at the lower band. Other indicators also suggest a
turn up.
Cyclical Industrial stocks (XLI-ETF) are still outperforming
the S&P 500 but Utilities (XLU-ETF) were well ahead of the Index today, so
we have mixed messages.
The Fosback Hi-Low Logic indicator is no longer giving a bearish
signal.
The Bear argument says that rising Bond Yields will give
us a big stock sell-off. So far, my technical indicators have not confirmed the
Bear scenario.
I remain a very cautious Bull, fully invested. We’ll just
have to see how this rough spot develops, if it develops. We’ll probably drop
below 2875 before this pullback ends.
MOMENTUM ANALYSIS:
TODAY’S RANKING OF
15 ETFs (Ranked Daily)
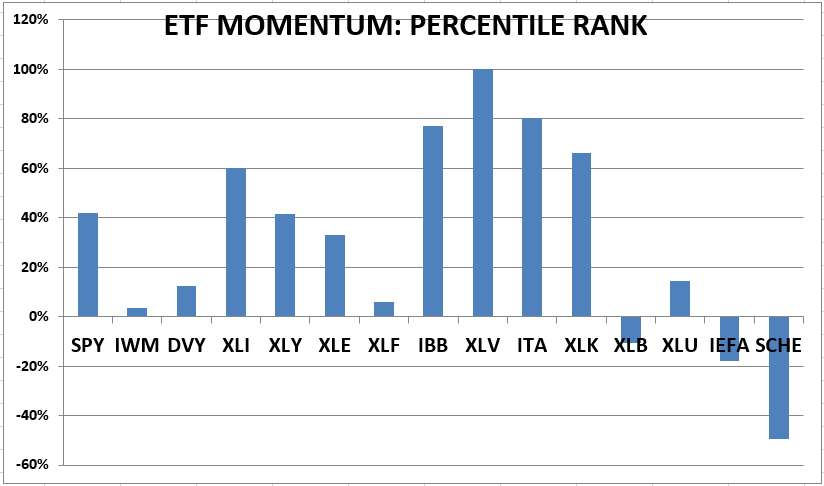
The top ranked ETF receives 100%. The rest are then
ranked based on their momentum relative to the leading ETF. While momentum isn’t stock performance per
se, momentum is closely related to stock performance. For example, over the
4-months from Oct thru mid-February 2016, the number 1 ranked Financials (XLF)
outperformed the S&P 500 by nearly 20%. In 2017 Technology (XLK) was ranked
in the top 3 Momentum Plays for 52% of all trading days in 2017 (if I counted
correctly.) XLK was up 35% on the year while the S&P 500 was up 18%.
*For additional background on the ETF ranking system see
NTSM Page at…
TODAY’S RANKING OF THE DOW 30 STOCKS (Ranked Daily)

The top ranked stock receives 100%. The rest are then
ranked based on their momentum relative to the leading stock.
*I rank the Dow 30 similarly to the ETF ranking system.
For more details, see NTSM Page at…
FRIDAY MARKET INTERNALS (NYSE DATA)
Market Internals remained
Negative on the market.
Market Internals are a decent trend-following analysis of
current market action but should not be used alone for short term trading. They
are usually right, but they are often late.
They are most useful when they diverge from the Index. In 2014, using these internals alone would
have made a 9% return vs. 13% for the S&P 500 (in on Positive, out on
Negative – no shorting).
I am now 50% invested in stocks. For me, fully invested
is a balanced 50% stock portfolio. As a retiree, this is a position with which
I am comfortable unless I am in full defense mode or feeling especially
optimistic.
INTERMEDIATE / LONG-TERM INDICATOR
Friday, the Price, Sentiment,
Volume & VIX indicators were neutral. Overall this is a NEUTRAL indication.