CHICAGO PMI (Investing.com)
“Manufacturing activity in the Chicago-area accelerated
in November to a four-and-a-half year high as new orders and production boosted
confidence, although the study noted concerns over labor issues and Chinese
tariffs. In a report, the Institute for Supply Management (ISM) said its Chicago
purchasing managers’ index rose to a seasonally adjusted
66.4 this month, from 58.4 in October.” Story at…
MARKET REPORT / ANALYSIS
-Friday the S&P 500 rose about 0.8% to 2760.
-VIX dropped about 4% to 18.07.
-The yield on the 10-year Treasury dipped to 3.003% as of
4:11pm.
Correction Over:
Thursday’s headlines said “Fed chairman’s comments send
market soaring.” Perhaps, but the spread between new-highs and new-lows showed
a huge bullish positive swing a week before the Fed chair speech and we noted
then that the correction was nearly over. We saw a positive test of the prior
low on the Friday before the Fed speech. Following the retest, Monday, stock
markets were up bigley (1.6%). They were
up again Tuesday. On Wednesday they were having a big day before the Fed speech
and jumped farther after the speech. Wednesday was very positive and was a 90%
up-volume day.
Regarding 90% up-volume days, one of the oldest stock
market advisor groups, Lowry Research, noted the following: “In approximately
half the cases in the past 69 years, the 90% Upside Day…which signaled a major
market reversal, occurred within five trading days or less of the market low.”
This time the reversal was 3-trading sessions after the low. The S&P 500 is
up nearly 5% since the Friday successful re-test. I am simply pointing out that
the media’s continual reporting of why the market moves up or down is probably
wrong and rather pointless. I don’t care.
The market action since last Friday’s retest tends to confirm the
correction is over - that’s what we care about.
My daily sum of 17 Indicators improved from +3 to +5 (a
positive number is bullish; negatives are bearish) while the 10-day smoothed
version that negates the daily fluctuations rose from -53 to -41.
It is still possible that we could see a retest of the
2633 low, but it is not likely that the S&P 500 would drop significantly
farther than the prior low. It could fall farther – it’s just not very likely.
There are, of course, news events that could upset the
apple cart – all we have to do is to hear Trump’s tariff tweets repeated on the
national news – so let’s hope all is quiet on the tariff front. Impeachment?
Who knows, some might see it as a positive.
As of Tuesday, I went from 30% invested in stocks to
fully invested in stocks plus about 10% extra since I think we made a bottom
last Friday.
In summary, still - “Looking good Billy Ray! Feeling good
Lewis!”
MOMENTUM ANALYSIS:
(Momentum analysis is suspect in a selloff, but since
we are coming off the bottom (I think) we might begin to use this data again. I‘d
be careful though – the only reason utilities are highly ranked among ETFs is
as an alternative to stocks in the correction.)
TODAY’S RANKING OF
15 ETFs (Ranked Daily)
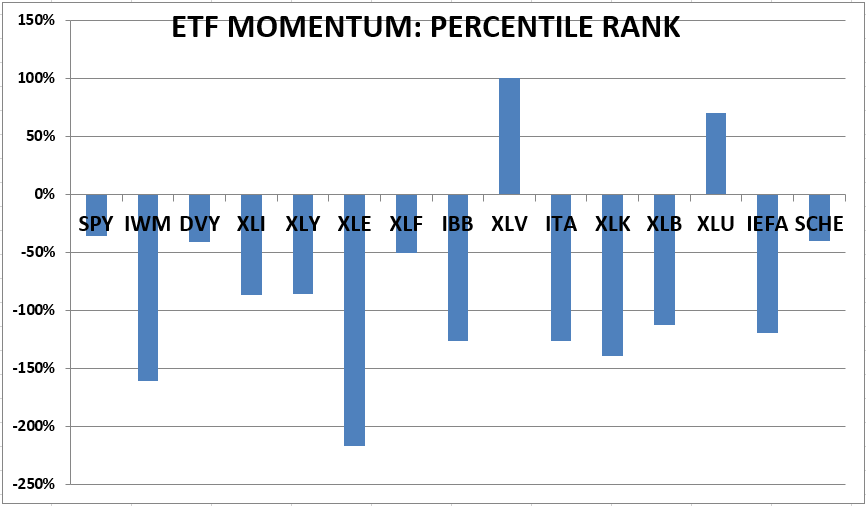
The top ranked ETF receives 100%. The rest are then
ranked based on their momentum relative to the leading ETF. While momentum isn’t stock performance per
se, momentum is closely related to stock performance. For example, over the
4-months from Oct thru mid-February 2016, the number 1 ranked Financials (XLF)
outperformed the S&P 500 by nearly 20%. In 2017 Technology (XLK) was ranked
in the top 3 Momentum Plays for 52% of all trading days in 2017 (if I counted
correctly.) XLK was up 35% on the year while the S&P 500 was up 18%.
*For additional background on the ETF ranking system see
NTSM Page at…
TODAY’S RANKING OF THE DOW 30 STOCKS (Ranked Daily)

The top ranked stock receives 100%. The rest are then
ranked based on their momentum relative to the leading stock.
*I rank the Dow 30 similarly to the ETF ranking system.
For more details, see NTSM Page at…
FRIDAY MARKET INTERNALS (NYSE DATA)
Market Internals
remained Neutral on the market, but they were almost positive.
Market Internals are a decent trend-following analysis of
current market action but should not be used alone for short term trading. They
are usually right, but they are often late.
They are most useful when they diverge from the Index. In 2014, using these internals alone would
have made a 9% return vs. 13% for the S&P 500 (in on Positive, out on
Negative – no shorting).
I am increasing stock allocations to 60% invested in
stocks Tuesday. For me, fully invested is a balanced 50% stock portfolio so
this is slightly higher. I will cut back to 50% if/when we reach the old highs
depending on indicators.
INTERMEDIATE / LONG-TERM INDICATOR
Friday, the Price
indicator was positive; Volume and Sentiment indicators were neutral; the VIX
indicator was negative. Overall this is a NEUTRAL indication, but improvements
to the numbers do support the belief that the bottom was Friday, 23 November.