“Industrial production edged up 0.1% in October, the
Federal Reserve said Friday, but there was a big upward revision that moved
third-quarter numbers significantly higher.” Story at…
MARKET REPORT / ANALYSIS
-Friday the S&P 500 rose about 0.2% to 2736.
-VIX dipped about 9% to 18.14.
-The yield on the 10-year Treasury was 3.066%.
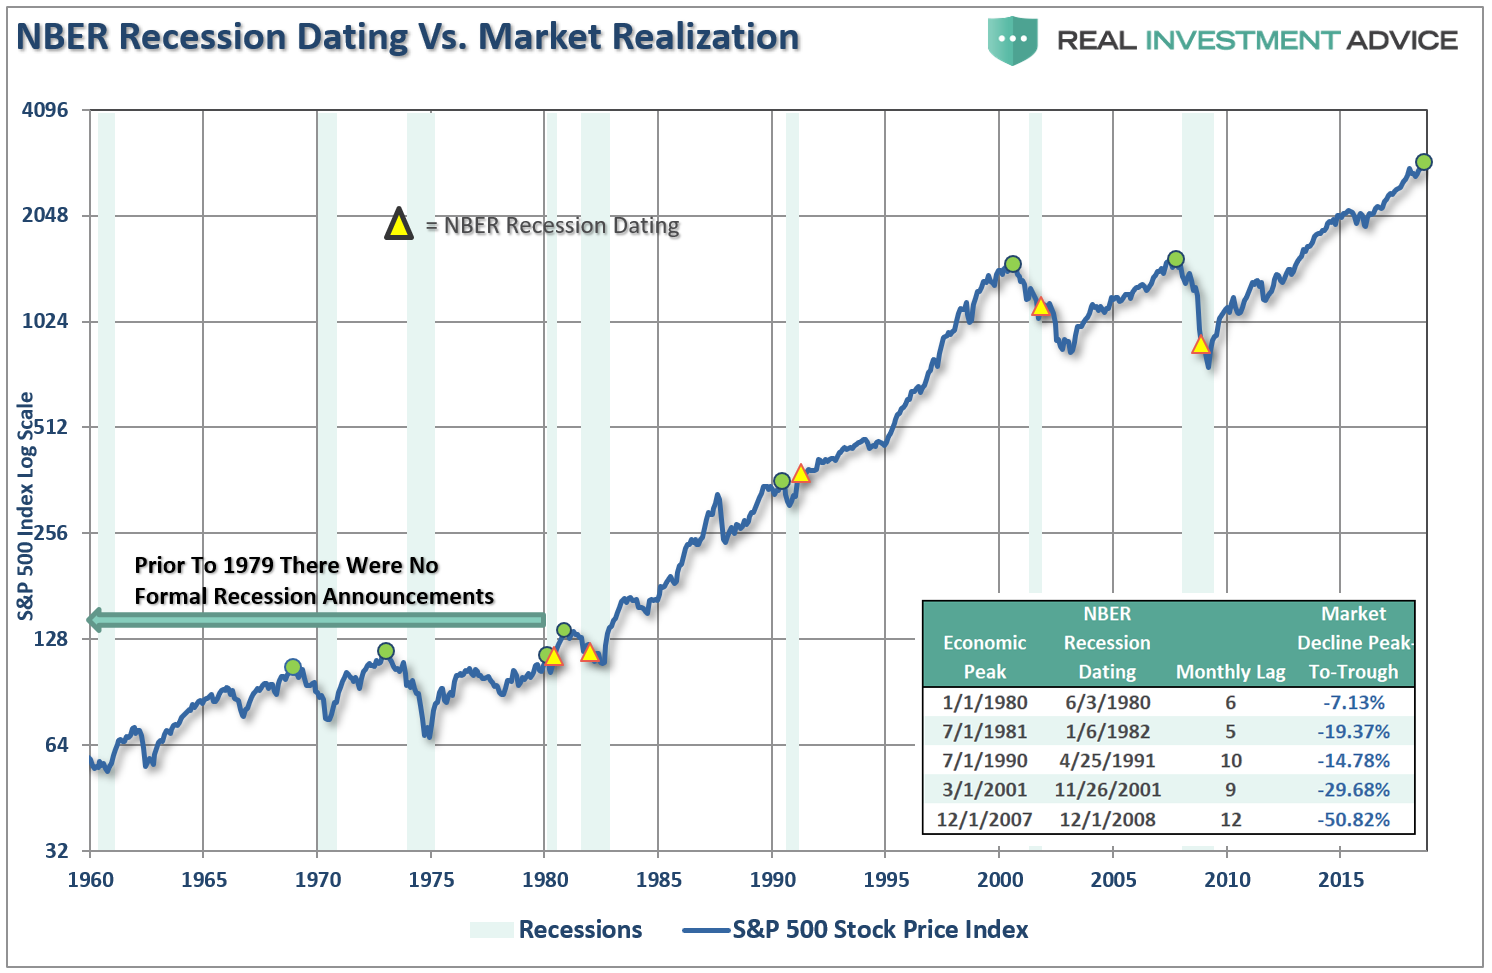
Unlike the talking heads on CNBC who routinely say that
we can’t have a stock market crash if there is no recession (therefor we have
not made a major top yet), I have suggested that stock market crashes can
precede and/or cause recessions. Here’s the evidence.

Chart from…
In 2000, the stock market top preceded the NBER recession
recognition by 7 months. In that case, 9 months after the recession started,
NBER said, “We’re in a recession.” The stock market peaked 2 months before the
economy did. For more, see the Real Investment site at the above address.
My daily sum of 17 Indicators improved slightly from -7
to -5 (a positive number is bullish; negatives are bearish) while the 10-day
smoothed version that negates the daily fluctuations slipped from +12 to +7.
Today is trading day 41 for this pullback (counting from
the top). The drop from the top is now 6.6% (9.9% max). These numbers are based
on closing data. Over the last 10-years, for drops less than 10%, the average
time from top to bottom has been 32-days to a final bottom, including a retest.
(The low usually occurs at the retest.) Except for major crashes, the average
correction was about 12% and lasted 53 trading-days including retests.
VIX dropped nicely today, but other indicators aren’t very
bullish. While VIX is coming down, it needs to drop faster before it gives a
bullish indication.
The 200-dMA is sloping down. The last time that happened
was during the correction that ended in Feb 2016. That one had a 14% dip, top to bottom. One wonders whether this might presage more
down moves for the S&P 500. Unfortunately, we don’t have enough data to say
one way or the other. A related indicator, the 150-day advance-decline line, is
still slightly positive. If it goes
negative it would be a significant bearish sign according to Lowry Research.
The most likely course remains that there will be retest
of the correction low, though it is far from certain. The Index is about 3%
above its prior low. VIX dropped again, but most internals are bearish or
unimpressive. We’ll have to see what happens if and when the S&P 500 tests
that 2641 low.
MOMENTUM ANALYSIS:
(Momentum analysis is not useful in a selloff.)
TODAY’S RANKING OF
15 ETFs (Ranked Daily)

The top ranked ETF receives 100%. The rest are then
ranked based on their momentum relative to the leading ETF. While momentum isn’t stock performance per
se, momentum is closely related to stock performance. For example, over the
4-months from Oct thru mid-February 2016, the number 1 ranked Financials (XLF)
outperformed the S&P 500 by nearly 20%. In 2017 Technology (XLK) was ranked
in the top 3 Momentum Plays for 52% of all trading days in 2017 (if I counted
correctly.) XLK was up 35% on the year while the S&P 500 was up 18%.
*For additional background on the ETF ranking system see
NTSM Page at…
*Over the last 2-months the only ETF that is up is the
XLU (Utilities) and it is up about 4% over that time frame.
TODAY’S RANKING OF THE DOW 30 STOCKS (Ranked Daily)

The top ranked stock receives 100%. The rest are then
ranked based on their momentum relative to the leading stock.
*I rank the Dow 30 similarly to the ETF ranking system.
For more details, see NTSM Page at…
FRIDAY MARKET INTERNALS (NYSE DATA)
Market Internals improved
to Neutral on the market.
Market Internals are a decent trend-following analysis of
current market action but should not be used alone for short term trading. They
are usually right, but they are often late.
They are most useful when they diverge from the Index. In 2014, using these internals alone would
have made a 9% return vs. 13% for the S&P 500 (in on Positive, out on
Negative – no shorting).
I am now 30% invested in stocks. For me, fully invested
is a balanced 50% stock portfolio.
Given that the S&P 500 has dropped below its
trendline (going back 2-1/2 years) and closed below the 200-dMA on consecutive
days, I have a defensive stance now. If
we have a successful test of the prior low, and that could happen soon, I’ll be
right back in. On the other hand, since
we don’t really know where the bottom is, I am taking the conservative route.
This move may result in underperforming the S&P 500, but there is a risk
that declines may be more than we expect resulting in even bigger losses.