“For the third quarter to date (with 90% of the companies
in the S&P 500 reporting actual results), companies are outperforming
recent averages in terms of the number of companies reporting positive
surprises and the magnitude of the positive surprises. In terms of earnings,
the percentage of companies reporting actual EPS above estimates (78%) is above
the 5-year average…In terms of sales, the percentage of companies reporting
sales above estimates (61%) is above the 5-year average. In aggregate, companies
are reporting sales that are 1.5% above estimates, which is also above the
5-year average.” Full report at…
JEFFREY SAUT COMMENTARY EXCERPT (Raymond James)
“Don’t look now, but the huge rally we’ve seen in U.S.
equities over the last few days has actually left the S&P 500’s 10-day
advance/decline line at its most overbought level in the past year! So while
the S&P’s price is still below its 50-day moving average, very near-term
internals suggest that we’re actually due for some downside mean reversion
again at this point.” Keep in mind that the aforementioned quote is merely a
“trading call” because as often stated in these reports, we think the lows were
made on October 29, 2018, given the extreme readings registered in late
October.” Commentary at…
MARKET REPORT / ANALYSIS
-Monday the S&P 500 slipped about 2% to 2726.
-VIX jumped about 18% to 20.45.
-The yield on the 10-year Treasury was 3.182% as of 4:59
pm Friday. Bond markets were closed
today.
The Index broke back below the long-term trend line from
Feb 2016 on Friday and dipped 1.3% below its 200-dMA today. At this point it
looks like a retest of the prior low of 2641 is coming. It is somewhat of a
surprise that the Overbought/Oversold Index is still overbought. That can’t be
good.
My daily sum of 17 Indicators slipped slightly from +4 to
+2 (a positive number is bullish; negatives are bearish) while the 10-day
smoothed version that negates the daily fluctuations improved from +9 to +13. I
must point out that most indicators are trend-following so the positive indicators
don’t make me feel particularly confident. As has been said many times, “It is difficult to make predictions, especially
about the future.” - Karl Kristen Steinke (also
attributed to Yogi Berra and others.)
Today is trading day 37 for this pullback (counting from
the top). The drop from the top is now 7% (9.9% max). These numbers are based
on closing data. Over the last 10-years, for drops less than 10%, the average
time from top to bottom has been 32-days to a final bottom, including a retest.
(The low is usually at the retest.) Except for major crashes, the average
correction was about 12% and lasted 53 trading-days including retests. We can’t
say for certain that this correction is over unto the market makes new highs.
Given that the S&P 500 has dropped below its
trendline (going back 2-1/2 years) and the 200-dMA, I reduced stock holdings to
30% today. That s a very conservative
move. If we have a successful test of
the prior low, and that could happen soon, I’ll be right back in. On the other hand, since we don’t really know
where the bottom is, I am taking the conservative route. This move may result
in underperforming the S&P 500, but there is a risk that declines may be
more than we expect resulting in bigger losses.
On a more positive note, today was a
statistically-significant, down-day. That
just means that the price-volume move down exceeded statistical parameters that
I track. The stats show that about 60% of the time a statistically significant
move down will be followed by an up-day the next day.
We’ll have to see what happens when the S&P 500 tests
the 2641 recent low.
MOMENTUM ANALYSIS:
(Momentum analysis is not useful in a selloff.)
TODAY’S RANKING OF
15 ETFs (Ranked Daily)

The top ranked ETF receives 100%. The rest are then
ranked based on their momentum relative to the leading ETF. While momentum isn’t stock performance per
se, momentum is closely related to stock performance. For example, over the
4-months from Oct thru mid-February 2016, the number 1 ranked Financials (XLF)
outperformed the S&P 500 by nearly 20%. In 2017 Technology (XLK) was ranked
in the top 3 Momentum Plays for 52% of all trading days in 2017 (if I counted
correctly.) XLK was up 35% on the year while the S&P 500 was up 18%.
*For additional background on the ETF ranking system see
NTSM Page at…
*Over the last 2-months the only ETF that is up is the
XLU (Utilities) and it is up about 1% over that time frame. That’s typical for
corrections, the flight to safety is Utilities and Consumer staples. I don’t
have a consumer staples in my ETF list, but looking at the DOW, only Johnson
and Johnson, Coke and Verizon were up today.
TODAY’S RANKING OF THE DOW 30 STOCKS (Ranked Daily)
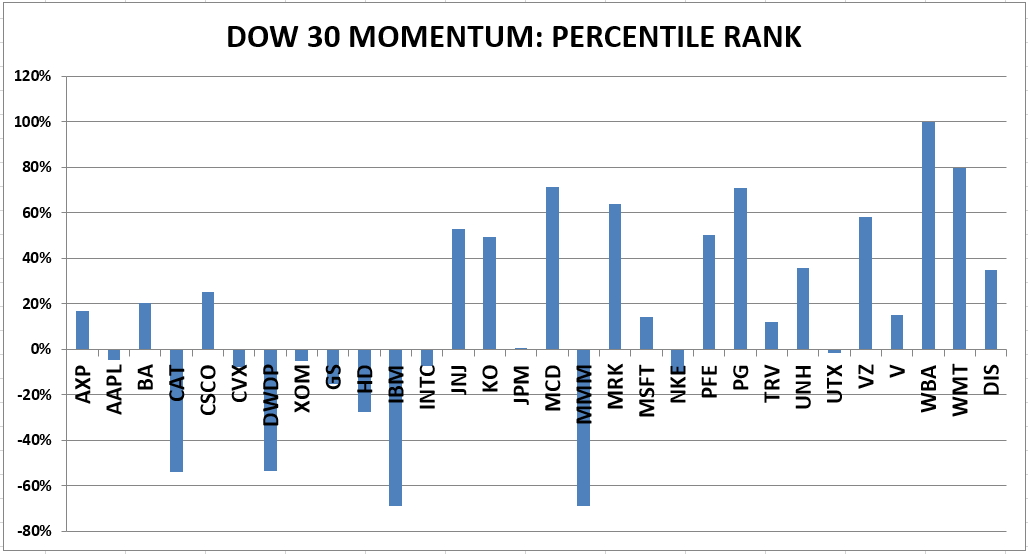
The top ranked stock receives 100%. The rest are then
ranked based on their momentum relative to the leading stock.
*I rank the Dow 30 similarly to the ETF ranking system.
For more details, see NTSM Page at…
MONDAY MARKET INTERNALS (NYSE DATA)
Market Internals slipped
to Neutral on the market.
Market Internals are a decent trend-following analysis of
current market action but should not be used alone for short term trading. They
are usually right, but they are often late.
They are most useful when they diverge from the Index. In 2014, using these internals alone would
have made a 9% return vs. 13% for the S&P 500 (in on Positive, out on
Negative – no shorting).
I am now 30% invested in stocks. For me, fully invested
is a balanced 50% stock portfolio, but as explained previously, I am taking a
very conservative stance until we see a retest of the recent low.
INTERMEDIATE / LONG-TERM INDICATOR - HOLD
Monday, the Price
& Volume indicators were positive; Sentiment was neutral; the VIX indicator
was negative. Overall this is a NEUTRAL indication.