“Trade what you see; not what you think.” – The Old Fool,
Richard McCranie, trader extraordinaire.
“The big money is not in the buying and selling. But in the
waiting.” - Charlie Munger, Vice Chairman, Berkshire Hathaway
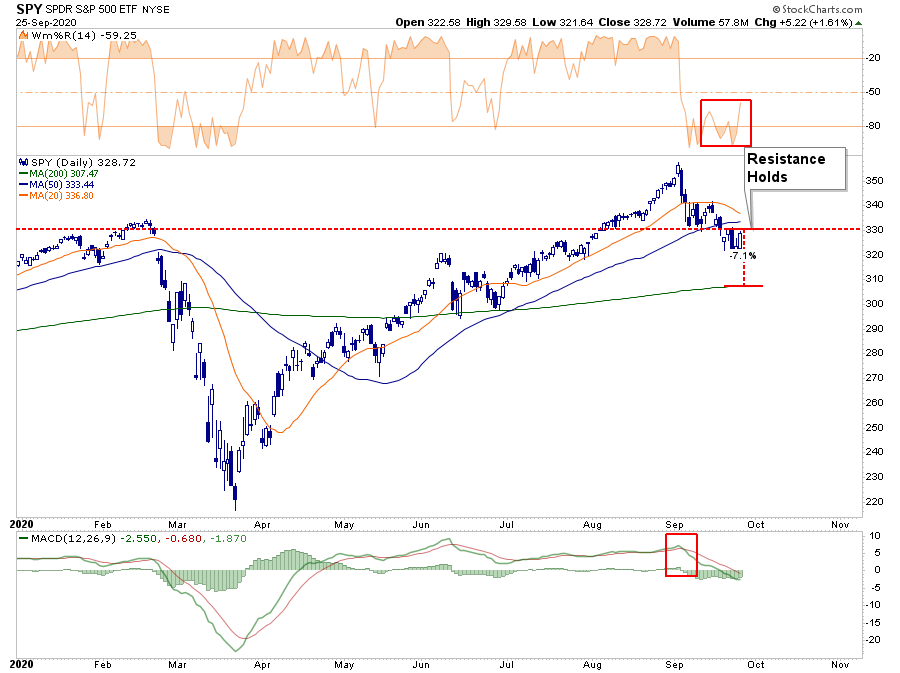
SELLOFF OVERDONE – THE CORRECTION MAY NOT BE (Real
Investment Advice, excerpt)
“In the chart below, we see the market rallied back to
the previous consolidation lows with the 20-dma approaching a cross of the
50-dma. Such would suggest more downward pressure on prices short-term.
The 200-dma is roughly 7% lower from Friday’s close.
If the market can break above resistance on Monday, clear
the 50- and 20-dma’s, then old highs should not be an issue.
But that will take a fair bit of work at a time where market risks
have increased.” – Lance Roberts

Commentary at...
https://realinvestmentadvice.com/the-sell-off-is-overdone-the-correction-may-not-be-09-25-20/
CORONAVIRUS (NTSM)
Here’s the latest from the COVID19 Johns Hopkins website at
5:00 Monday. US total case numbers are on the left axis; daily numbers are on
the right side of the graph with the 10-dMA of daily numbers in Green.

MARKET REPORT / ANALYSIS
-Monday the S&P 500 rose about 1.6% to 3352.
-VIX fell about 0.7% to 26.19. (That’s very small for
such a big move higher in the S&P 500; Options Players are unimpressed by
the rally.)
-The yield on the 10-year Treasury rose to 0.661%.
Regular readers know that I track the number of days that
the S&P 500 closed in positive territory (up-days) over given time-periods
as indicators of overbought conditions. At the recent top on 2 September, 9 out
of the 10 previous trading days were up-days. That’s a bearish sign suggesting
some sort of pullback. We also noted
that over a 20-day period, 16-days were up days. That is a more intense bear sign and it
occurred 3 days before the recent top. We saw these signs at the top of the 7%
decline in May 2019.
There is another time-period I track that rarely gives a
signal. I have not seen it in a decade. When 67 days out of the past 100 are
up-days, it is a very bearish sign. It has only signaled once in the past 10
years, the day before the top of a 16% correction in 2010. Since 67 up-days are
rare, I checked to see when 66 days were up out of 100. Those 66 numbers were
clustered, again, at the top in 2010...and at the recent 2 Sept Top.
Since a sample size of 1 doesn’t mean much, we should consider
this along with 2 other bear-signs that signal tops of larger corrections: (1) the
S&P 500 was 16% above its 200-dMA at the 2 Sept top; (2) the % of issues advancing
at several of the recent tops was only 2.2%.
These all suggest that the current correction is likely
to be fall at least to the 200-dMA. That doesn’t mean that it will – just that
the likelihood is higher than in most corrections.
For now, it appears we are in a counter-trend rally. So
far, we have retraced back to 0.1% below the 50-dMA, and about 33% of the total
drop from the prior high. A 50% retracement would be not be a surprise before
selling resumes.
As of today, the S&P 500 is down 6.4% from its
all-time high. This is day 17 of the correction. The average time from top to
bottom for a correction is 35-days for corrections less than 10% and 68-days
for bigger corrections. The 200-dMA is now 3107, 7.8% below today’s close.
The daily sum of 20 Indicators improved from -4 to -2 (a
positive number is bullish; negatives are bearish). The 10-day smoothed sum
that smooths the daily fluctuations improved from -22 to -16. (These numbers
sometimes change after I post the blog based on data that comes in late.) Most
of these indicators are short-term and many are trend following.
I remain bearish.
MOMENTUM ANALYSIS:
TODAY’S RANKING OF
15 ETFs (Ranked Daily)
The top ranked ETF receives 100%. The rest are then ranked based on their momentum relative to the leading ETF.

*For additional background on the ETF ranking system see
NTSM Page at…
http://navigatethestockmarket.blogspot.com/p/exchange-traded-funds-etf-ranking.html
TODAY’S RANKING OF THE DOW 30 STOCKS (Ranked Daily)
Here’s the revised DOW 30 and its momentum analysis. The
top ranked stock receives 100%. The rest are then ranked based on their
momentum relative to the leading stock.

For more details, see NTSM Page at…
https://navigatethestockmarket.blogspot.com/p/a-system-for-trading-dow-30-stocks-my_8.html
MONDAY MARKET INTERNALS (NYSE DATA)
Market Internals improved
to NEUTRAL on the market.
Market Internals are a decent trend-following analysis of
current market action, but should not be used alone for short term trading.
They are usually right, but they are often late. They are most useful when they diverge from
the Index.

Using the Short-term indicator in 2018 in SPY would have
made a 5% gain instead of a 6% loss for buy-and-hold. The methodology was Buy
on a POSITIVE indication and Sell on a NEGATIVE indication and stay out until
the next POSITIVE indication. The back-test included 13-buys and 13-sells, or a
trade every 2-weeks on average.

My current stock allocation is about 30% invested in
stocks. You may wish to have a higher or lower % invested in stocks depending
on your risk tolerance. 30% is a conservative position that I re-evaluate daily,
but it is appropriate for the correction.
As a retiree, 50% in the stock market is about fully
invested for me – it is a cautious and conservative number. If I feel very
confident, I might go to 60%; if this correction is deep enough, 80% would not
be out of the question.