“The big money is not in the buying and selling. But in the waiting.” - Charlie Munger, Vice Chairman, Berkshire Hathaway
CONSUMER PRICE INDEX (Marketwatch)
“The cost of U.S. goods and services rose sharply in August for the third month in a row, but the increase mostly stemmed from a rebound in prices after a steep decline early in the coronavirus pandemic. Overall inflation is still quite low. The consumer price index, a measure of the cost of living, rose 0.4% last month…” Story at…
https://www.marketwatch.com/story/consumer-prices-rise-sharply-for-third-month-in-a-row-but-inflation-still-low-and-expected-to-stay-that-way-2020-09-11
M&A IS GOING TO MAKE INVESTORS WISH THEY SOLD SOONER (MarketWatch)
“The resurgence of M&A activity is a bad omen for the stock market…M&A activity tends to come in waves, and all past waves have ended badly for the stock market. Matthew Rhodes-Kropf, an MIT Sloan finance professor and an expert in the M&A field, said in an interview that “each of the last six great merger waves on record” — going back more than 125 years — “ended with a precipitous decline in equity prices.”
https://www.marketwatch.com/story/whats-happening-now-with-ma-is-going-to-make-todays-stock-investors-wish-theyd-sold-sooner-2020-09-10?mod=home-page
BOTTOM STILL AHEAD (Heritage Capital)
“The decline could wrap up next week or perhaps not until October. For the foreseeable future, I do not like the Fab Five Plus. I think the other indices will outperform. That puts me in a tough spot because two of our strategies have had major exposure to the group all year…” - Paul Schatz, President, Heritage Capital. Commentary at…
https://investfortomorrow.com/blog/bottom-still-ahead-of-us/
CORONAVIRUS (NTSM)
Here’s the latest from the COVID19 Johns Hopkins website at 5:40 Friday. Total US numbers are on the left axis; daily numbers are on the right side of the graph with the 10-dMA of daily numbers in Green.

MARKET REPORT / ANALYSIS
-Friday the S&P 500 rose about 0.1% to 3341.
-VIX fell about 10% to 26.87
-The yield on the 10-year Treasury slipped to 0.671%.
The S&P 500 dropped below its 50-dMA in the afternoon and then rallied to close 0.6% above it. So far, the Index has tested the 50-dMA three times and held each time. It’s possible that we’ve seen an end to the correction. Market Internals don’t support that conclusion so we’ll have to wait until next week for more information. It is also very early for this trouble to be over.
Here’s the Friday run-down of some important indicators. These tend to be both long-term and short-term so they are somewhat different than the 20 that I report on daily.
BULL SIGNS
-The 50-dMA and the 100-dMA of the % of stocks advancing on the NYSE (Breadth) is above 50%.
-Cyclical Industrials (XLI-ETF) are outperforming the S&P 500.
-The S&P 500 is still outperforming the Utilities ETF (XLU). It has been falling, but I’ll keep it in the bull column. Seems like no one wants to own utilities now.
-51% of the 15-ETFs that I track have been up over the last 10-days – bullish.
NEUTRAL
-The 5-10-20 Timer System is nearly sell; for now the 5-dEMA is above while the 20-dEMA is below the 20-dEMA.
-Overbought/Oversold Index, a measure of advance-decline data is neutral.
-Non-crash Sentiment is rising as dip-buyers jump in but the indicator remains neutral.
-The Fosback High-Low Logic Index is neutral.
-There have been 13 up-days over the last 20 days. Neutral
-We’ve seen 5 up-days over the last 10-days. Neutral
-Bollinger Bands.
-RSI.
-VIX.
-Breadth on the NYSE vs the S&P 500 index is neutral.
-The S&P 500 is 7.9% above its 200-dMA. When Sentiment is considered, the signal is neutral.
BEAR SIGNS
-The size of up-moves has been smaller than the size of down-moves over the last month.
-The smoothed advancing volume on the NYSE is headed down.
-MACD of stocks advancing on the NYSE (breadth) made a bearish crossover 11 Sept.
-MACD of S&P 500 price made a bearish crossover 4 September.
-The 10-dMA of stocks advancing on the NYSE (Breadth) is below 50%.
-Statistically, the S&P 500 gave a panic-signal, 3 September. A panic signal usually suggests more to come. (This signal remains in effect for 7-trading days.)
-The Smart Money (late-day action) is bearish. This indicator is based on the Smart Money Indicator (a variant of the indicator developed by Don Hayes).
-Long-term new-high/new-low data.
-Short-term new-high/new-low data.
-My Money Trend indicator is bearish.
-Only 2.3% of all issues traded on the NYSE made new, 52-week highs when the S&P 500 made a new all-time-highs last week. Recent new-highs have shown an extremely narrow advance.
On Friday, 21 February, 2 days after the top of the Coronavirus pullback, there were 10 bear-signs and 1 bull-sign. Now there are 11 bear-signs and 4 bull-signs. Last week, there were 9 bear-signs and 7 bull-signs.
As of today, the S&P 500 is down 6.7% from its all-time high. This is day 6 of the correction. The average time from top to bottom for a correction is 35-days for corrections less than 10% and 68-days for bigger corrections.
The Long Term NTSM indicator ensemble remained SELL. Volume, Price and the Panic Indicator are bearish. It has been SELL for the last 4 days.
The daily sum of 20 Indicators improved from -9 to -8 (a positive number is bullish; negatives are bearish). The 10-day smoothed sum that smooths the daily fluctuations dropped from -10 to -24. (These numbers sometimes change after I post the blog based on data that comes in late.) Most of these indicators are short-term and many are trend following.
I’ll be watching for improvements in internals and looking for a bottom. No bottom yet. If past history is a guide, we may expect more than a 10% correction.
I remain bearish in the short and intermediate term. I have a small short position in the Nasdaq 100 and a significant short position on the S&P 500 (but not more than 15% of the stock-portfolio – I am retired; no need to risk the nest egg).
MOMENTUM ANALYSIS:
TODAY’S RANKING OF 15 ETFs (Ranked Daily)
The top ranked ETF receives 100%. The rest are then ranked based on their momentum relative to the leading ETF.

*For additional background on the ETF ranking system see NTSM Page at…
http://navigatethestockmarket.blogspot.com/p/exchange-traded-funds-etf-ranking.html
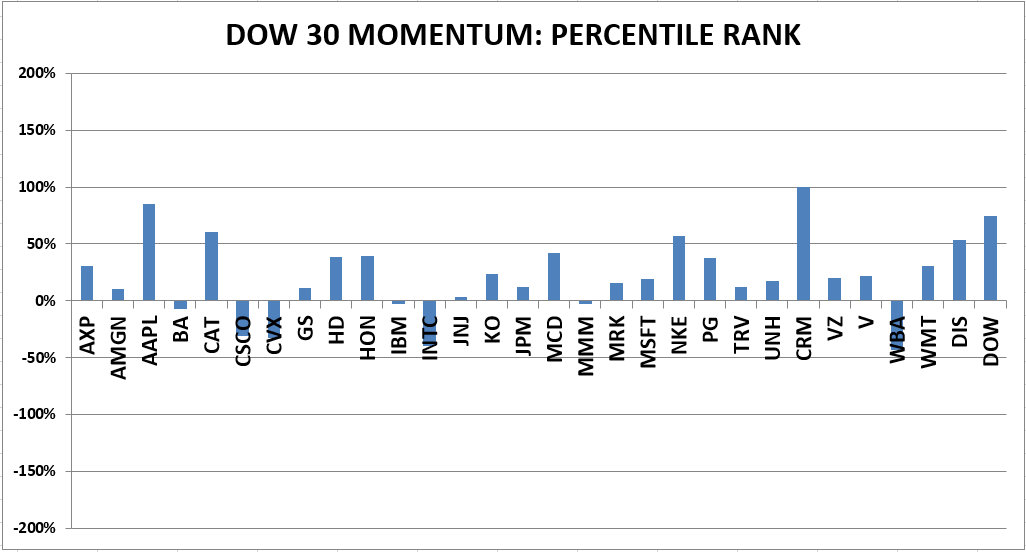
TODAY’S RANKING OF THE DOW 30 STOCKS (Ranked Daily)
Here’s the revised DOW 30 and its momentum analysis. The top ranked stock receives 100%. The rest are then ranked based on their momentum relative to the leading stock.
For more details, see NTSM Page at…
https://navigatethestockmarket.blogspot.com/p/a-system-for-trading-dow-30-stocks-my_8.html
FRIDAY MARKET INTERNALS (NYSE DATA)
Market Internals are a decent trend-following analysis of current market action, but should not be used alone for short term trading. They are usually right, but they are often late. They are most useful when they diverge from the Index.
Using the Short-term indicator in 2018 in SPY would have made a 5% gain instead of a 6% loss for buy-and-hold. The methodology was Buy on a POSITIVE indication and Sell on a NEGATIVE indication and stay out until the next POSITIVE indication. The back-test included 13-buys and 13-sells, or a trade every 2-weeks on average.
As a retiree, 50% in the stock market is about fully invested for me – it is a cautious and conservative number. If I feel very confident, I might go to 60%; had we seen a successful retest of the bottom, 80% would not have been out of the question.
This Post was done with the older "Lagacy" blogger. It's easier to use, but the fonts are still messed up and I don't have tome to play with it. The NEW blogger system is useless.