“Trade what you see; not what you think.” – The Old Fool,
Richard McCranie, trader extraordinaire.
“Faced with a combination of record speculative extremes
and deteriorating speculative conditions, investors may want to remember that
the best time to panic is before everyone else does.” – John Hussman, Phd.
FED BEIGE BOOK (Fox Business)
Supply chain bottlenecks, the highest inflation in
decades and a persisting labor shortage are weighing on businesses across the
country, according to a new Federal Reserve report. In its
region-by-region roundup of anecdotal information known as the Beige Book, the
Fed reported that while economic activity
increased at a "moderate pace" in most of its 12 districts during the
February through mid-April period that the report covers, firms continued to
struggle with rising prices and a lack of available workers.” Story at...
EXISTING HOME SALES (Yahoo Finance)
“Housing activity slowed for a second straight month in
March. Existing home sales fell 2.7% to a seasonally adjusted 5.77 million
units in March from a month earlier...” Story at...
https://finance.yahoo.com/news/existing-home-sales-march-2022-140010177.html
EIA CRUDE INVENTORIES (EIA)
“U.S. commercial crude oil inventories (excluding those
in the Strategic Petroleum Reserve) decreased by 8.0 million barrels from the
previous week. At 413.7 million barrels, U.S. crude oil inventories are about
15% below the five-year average for this time of year.” Report at...
https://ir.eia.gov/wpsr/wpsrsummary.pdf
My cmt: Falling inventories suggest increased demand and
higher prices and this data does not include the Strategic Oil Supply. It is
being reduced by 20% and sold to reduce gas prices.
MULTIYEAR RECORDS FOR AAII SURVEY (McClellan Financial
Publications)
“The American Association of Individual Investors (www.aaii.com) surveys its members every week to
see if they are bullish, bearish, or neutral. This week’s data, released
on Thursday, April 14, 2022, showed the most negative bull-bear spread since
April 2013... But these survey respondents, like in most other surveys, have an
excellent track record of being wrong when they all move together. That
should mean an opportunity for prices to rebound, even if only for a short
time, just to surprise the crowd to the greatest extent possible.” Commentary
at...
https://www.mcoscillator.com/learning_center/weekly_chart/multiyear_records_for_aaii_survey/
My cmt: The bounce is happening now and it may be, as Tom
McClellan warned, “only for a short time.”
EARNINGS GROWTH (FACTSET – Pub 12 Apr)
“...despite the negative impacts cited by these 20
companies [who had reported by 12 Apr], they have reported aggregate
(year-over-year) earnings growth of 18.5% and average (year-over-year) earnings
growth of 22.7%. It appears most of these companies are raising prices to
offset these negative impacts, as 18 of these 20 companies (90%) discussed
increasing prices or improving price realization on their earnings calls.”
Report at...
MARKET REPORT / ANALYSIS
-Wednesday the S&P 500 slipped about 0.1% to 4459.
-VIX dropped about 5% to 20.32.
-The yield on the 10-year Treasury was down to 2.845%.
PULLBACK DATA:
If the correction has ended:
-Drop from Top: 13% (Avg.= 13% for non-crash pullbacks)
-Days from Top to Bottom: 48-days. (Avg= 30 days top to
bottom for corrections <10%; 60 days top to bottom for larger, non-crash
pullbacks)
Currently:
If the correction has not ended:
Days since top: 74 (Avg= 60 days top to bottom for
>10% non-crash pullbacks)
Drop from Top: Now 6.9%. Max at close: 13%
The S&P 500 is 0.7% BELOW its 200-dMA & 1.2% ABOVE
its 50-dMA.
*We can’t call the end of the correction until the
S&P 500 makes a new high. If it makes a new low, then the correction has
obviously not ended.
TODAY’S COMMENT:
Markets faded after the FED Beige Book was released at
2PM. I don’t think there were any real surprises – it just reminded investors
that there are a lot of questions concerning the economy.
The McClellan Oscillator remained bullish, so the
currently bearish 10-day version of the Fosback Hi-Low Logic Index can be
ignored.
Today, the daily sum of 20 Indicators improved from zero
to +6 (a positive number is bullish; negatives are bearish); the 10-day
smoothed sum that smooths the daily fluctuations improved from -6 to -37 (The
trend direction is more important than the actual number for the 10-day value.)
These numbers sometimes change after I post the blog based on data that comes
in late. Most of these 20 indicators are short-term so they tend to bounce
around a lot.
The Long Term NTSM indicator switched
to BUY: VIX is Bullish and only 45-days have been up in the last 100, also
bullish; VOLUME, SENTIMENT & PRICE are hold. I am reserving judgement on
the LT NTSM indicator as noted below.
It’s frustrating to see the indicators switching to the
Bull side. I don’t like getting
whipsawed by back-and-forth trading signals. That is why I noted yesterday that
perhaps I should only follow the Long-Term Indicator. Now that the Long-Term Indicator has switched
to bullish, should I be bullish? Maybe, maybe not. The short-term indicator is still HOLD and
the Long-Term Indicator ensemble is not sending a very strong signal.
As I have noted before, the fact that only 45-days have
been up over the last 100 is bullish, but in a bear market, this number does not
guarantee that the bottom is in. When I
looked back to 2008 and 2009 bear market, only 47-days had been up (out of 100)
when the S&P 500 made its bottom in March 2009. The problem is that at the
end of Dec 2008, the data indicates that, again, only 47-days had been up (out
of 100). The Index fell another 25% from
Dec 2008 to the final low. That points out that in bear markets, the 100-day
number can remain low for extended times.
On the other hand, at the first bottom in Nov 2008, only
45-days had been up over the previous 100.
That’s today’s number, so this could still be a decent low signal for
current conditions, but I am not in a rush.
Bottom line: I’ll wait for the short-term indicator to
confirm the Long-term Buy and I’ll also look for a stronger Long-Term Buy
signal before I add to stock holdings. In the meantime, I’ll try to find the
time to check the 2000-2001 bear market for stats on the days-up out of 100.
I remain a Bear for the long-term, but this bounce may be
tradable for aggressive traders and it could be a buying opportunity. Let’s see
what happens tomorrow.
BEST ETFs - MOMENTUM ANALYSIS:
TODAY’S RANKING OF 15 ETFs
(Ranked Daily)
The top ranked ETF receives
100%. The rest are then ranked based on their momentum relative to the leading ETF.
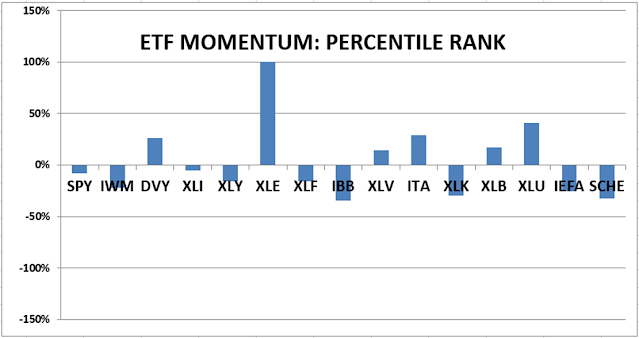
http://navigatethestockmarket.blogspot.com/p/exchange-traded-funds-etf-ranking.html
BEST DOW STOCKS - TODAY’S MOMENTUM
RANKING OF THE DOW 30 STOCKS (Ranked Daily)
Here’s the revised DOW 30 and
its momentum analysis. The top ranked stock receives 100%. The rest are then
ranked based on their momentum relative to the leading stock.

https://navigatethestockmarket.blogspot.com/p/a-system-for-trading-dow-30-stocks-my_8.html
WEDNESDAY MARKET INTERNALS
(NYSE DATA)

Market Internals are a decent
trend-following analysis of current market action, but should not be used alone
for short term trading. They are usually right, but they are often late. They are most useful when they diverge from
the Index.
My stock-allocation in the
portfolio is now about 35% invested in stocks. This is below my “normal” fully
invested stock-allocation of 50%.
I trade about 15-20% of the
total portfolio using the momentum-based analysis I provide here. If I can see
a definitive bottom, I’ll add a lot more stocks to the portfolio using an
S&P 500 ETF.
You may wish to have a higher
or lower % invested in stocks depending on your risk tolerance. 50% is a
conservative position that I consider fully invested for most retirees.
As a general rule, some
suggest that the % of portfolio invested in the stock market should be one’s
age subtracted from 100. So, a
30-year-old person would have 70% of the portfolio in stocks, stock mutual
funds and/or stock ETFs. That’s ok, but
for older investors, I usually don’t recommend keeping less than 50% invested
in stocks (as a fully invested position) since most people need some growth in
the portfolio to keep up with inflation.