“Trade what you see; not what you think.” – The Old Fool,
Richard McCranie, trader extraordinaire.
“Faced with a combination of record speculative extremes
and deteriorating speculative conditions, investors may want to remember that
the best time to panic is before everyone else does.” – John Hussman, Phd.
NAHB HOUSING MARKET INDEX (CNBC)
“Sharply rising mortgage rates are taking their toll on
the nation’s homebuilders, as already pricey new construction becomes even less
affordable. Builder confidence in the market for new single-family homes fell 2
points to 77 in April...” Story at...
https://www.cnbc.com/2022/04/18/homebuilder-sentiment-drops-for-fourth-straight-month.html
AMERICAN RESCUE PLAN, AN EXTRAORDINARY MISTAKE (msn.com)
“Obama-era
economic advisor Stephen Rattner warned that the U.S. may be on track for a
recession just as the race for 2024 kicks off, a conundrum he blames on 'poor
economic policy' from President Biden, Congress and the Federal Reserve.” Story
at...
Steve
Rattner says American Rescue Plan was 'extraordinary mistake' (msn.com)
MARKET REPORT / ANALYSIS
-Monday the S&P 500 fell about 1point to 4392.
-VIX dipped about 2% to 22.17.
-The yield on the 10-year Treasury rose to 2.856%.
PULLBACK DATA:
If the correction has ended:
-Drop from Top: 13% (Avg.= 13% for non-crash pullbacks)
-Days from Top to Bottom: 48-days. (Avg= 30 days top to
bottom for corrections <10%; 60 days top to bottom for larger, non-crash
pullbacks)
Currently:
If the correction has not ended:
Days since top: 72 (Avg= 60 days top to bottom for
>10% non-crash pullbacks)
Drop from Top: Now 8.4%. Max at close: 13%
The S&P 500 is 2.3% BELOW its 200-dMA & 0.6%
BELOW its 50-dMA.
*We can’t call the end of the correction until the
S&P 500 makes a new high.
TODAY’S COMMENT:
Outside Reversal Pattern: “An outside reversal is a price
pattern that indicates a potential change in trend on a price chart. The
two-day pattern is observed when a security’s high and low prices for the day
exceed the high and low of the previous day’s trading session.” For more,
see....
https://www.investopedia.com/terms/o/outsidereversal.asp
Since I have seen references to this indicator, usually
by chart-guys doing candlestick analysis, I decided to investigate it to see if
I should add it into my analysis. I had
the idea that it would be a significant signal for reversals. I was surprised
to see that the indicator is very common, and sometimes the results were almost
random. Bearish signals were followed by
upturns; bullish signals happened before downturns and so forth. I did see
another site where it stated that the pattern must be very strong before the
reversal signal. It suggested that the
signal should be preceded by 4-days on one direction before the reversal signal
could be considered actionable. That’s
not very helpful since after 4 consecutive-days in one direction, a short-term reversal
would be expected anyway.
Since I already have data for the number of days up in 10
and 20-day time-periods, I decided to link the reversal indicator to it. Now my
Outside Reversal Indicator will only signal if the 10-day trend has been
opposite the reversal indication. (The 10-day seemed to work better than the
20-day.) This change seems to have made the indicator more reliable, although
that remains to be seen.
For what it’s worth, the S&P 500 experienced a Bearish
Outside Reversal Day recently, on 5 April. There had been 6 up-days prior to
the signal. For now, I’ll just keep this indicator in mind, but I am reserving
final judgement. Currently, I do not count this indicator in any of my daily or
weekly indicator totals.
Market Internals were weak today (Monday) while the
S&P 500 was up. Usually, that means
a down-day for tomorrow (Tuesday), but as I write this, Futures are pointing up
– go figure. I also note that the
overbought/oversold Index was oversold today, so that tends to suggest a short-term
bounce, but it is not guaranteed.
Today, the daily sum of 20 Indicators improved from -5 to
-3 (a positive number is bullish; negatives are bearish); the 10-day smoothed
sum that smooths the daily fluctuations declined from -36 to -44 (The trend direction
is more important than the actual number for the 10-day value.) These numbers
sometimes change after I post the blog based on data that comes in late. Most
of these 20 indicators are short-term so they tend to bounce around a lot.
The Long Term NTSM indicator
ensemble is mixed, but remained HOLD: VIX is Bullish; VOLUME is bearish; SENTIMENT
& PRICE are hold.
With the S&P 500’s failure to hold the 50-dMA last week,
I am now a Bear. That may change quickly if earnings turn out ok and the
markets turn up.
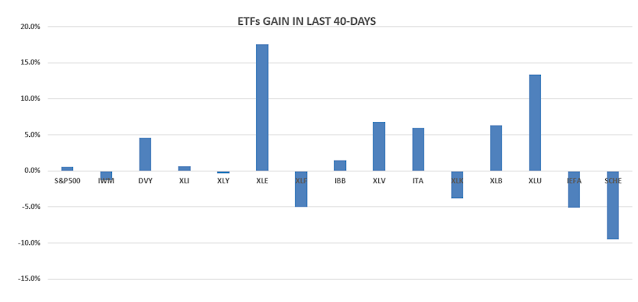
BEST ETFs - MOMENTUM ANALYSIS:
TODAY’S RANKING OF 15 ETFs
(Ranked Daily)
The top ranked ETF receives
100%. The rest are then ranked based on their momentum relative to the leading ETF.

http://navigatethestockmarket.blogspot.com/p/exchange-traded-funds-etf-ranking.html
BEST DOW STOCKS - TODAY’S MOMENTUM RANKING OF THE DOW 30 STOCKS (Ranked Daily)
Here’s the revised DOW 30 and
its momentum analysis. The top ranked stock receives 100%. The rest are then
ranked based on their momentum relative to the leading stock.

https://navigatethestockmarket.blogspot.com/p/a-system-for-trading-dow-30-stocks-my_8.html

MONDAY MARKET INTERNALS (NYSE DATA)

Market Internals are a decent
trend-following analysis of current market action, but should not be used alone
for short term trading. They are usually right, but they are often late. They are most useful when they diverge from
the Index.
My stock-allocation in the
portfolio is now about 35% invested in stocks. This is below my “normal” fully
invested stock-allocation of 50%.
I trade about 15-20% of the
total portfolio using the momentum-based analysis I provide here. If I can see
a definitive bottom, I’ll add a lot more stocks to the portfolio using an
S&P 500 ETF.
You may wish to have a higher
or lower % invested in stocks depending on your risk tolerance. 50% is a
conservative position that I consider fully invested for most retirees.
As a general rule, some
suggest that the % of portfolio invested in the stock market should be one’s
age subtracted from 100. So, a
30-year-old person would have 70% of the portfolio in stocks, stock mutual
funds and/or stock ETFs. That’s ok, but
for older investors, I usually don’t recommend keeping less than 50% invested
in stocks (as a fully invested position) since most people need some growth in
the portfolio to keep up with inflation.