“Trade what you see; not what you think.” – The Old Fool,
Richard McCranie, trader extraordinaire.
“Faced with a combination of record speculative extremes
and deteriorating speculative conditions, investors may want to remember that
the best time to panic is before everyone else does.” – John Hussman, Phd.
HOUSING STARTS / PERMITS (CNBC)
“U.S. homebuilding unexpectedly rose in March, but starts
for single-family housing tumbled amid rising mortgage rates. Housing starts
increased 0.3%...last month... Permits for future homebuilding increased 0.4%...Single-family
housing starts, which account for the biggest share of homebuilding, dropped
1.7%...” Story at...
MARKET REPORT / ANALYSIS
-Tuesday the S&P 500 rose about 1.6% to 4462.
-VIX dipped about 4% to 21.37.
-The yield on the 10-year Treasury rose to 2.974%.
PULLBACK DATA:
If the correction has ended:
-Drop from Top: 13% (Avg.= 13% for non-crash pullbacks)
-Days from Top to Bottom: 48-days. (Avg= 30 days top to
bottom for corrections <10%; 60 days top to bottom for larger, non-crash
pullbacks)
Currently:
If the correction has not ended:
Days since top: 73 (Avg= 60 days top to bottom for
>10% non-crash pullbacks)
Drop from Top: Now 7%. Max at close: 13%
The S&P 500 is 0.8% BELOW its 200-dMA & 1% ABOVE
its 50-dMA.
*We can’t call the end of the correction until the
S&P 500 makes a new high.
TODAY’S COMMENT:
There was a broad rally Tuesday. Of the 46 issues I follow
(15 ETFs, 30 Dow stocks + Junk Bonds) only 6 issues were down. New-highs were
lower today than yesterday and there was a big move up. That seemed odd, but when I looked at recent big
up-days when new-lows were lower than the previous day, it turned out to be fairly
common.
Today was a statistically significant up-day. That just
means that the price-volume move exceeded my statistical parameters. Statistics
show that a statistically-significant, up-day is followed by a down-day about
60% of the time.
Today was also a Follow-Through Day. That cancels any Distribution Days over the
last 5-weeks. Distribution Days were almost giving a bearish signal, because
there had been 5 over the last 5-weeks.
The McClellan Oscillator turned bullish (but just
barely). That cancels the Hindenburg Omen from 8 April and recent Fosback
Hi-Low Logic bear signs, although the bearish 10-dEMA of the Fosback H/L Logic
Index will be re-established unless the McClellan Oscillator remains above zero.
Fosback’s 10-day version is a short -term indicator.
Follow-Through Days; Distribution Days; McClellan
Oscillator; Hindenburg Omen; Fosback Hi-Low Logic Index. Are you kidding me?
Are they making this stuff up? A lot of “experts” sold a lot of books on these “technicals.”
Today, the daily sum of 20 Indicators improved from -3 to
zero (a positive number is bullish; negatives are bearish); the 10-day smoothed
sum that smooths the daily fluctuations declined from -44 to -46 (The trend
direction is more important than the actual number for the 10-day value.) These
numbers sometimes change after I post the blog based on data that comes in
late. Most of these 20 indicators are short-term so they tend to bounce
around a lot.
With the VIX above 20 the markets are gyrating
around. It may be that many of my short
to medium term indicators are too sensitive.
Maybe I should only pay attention to the long-term indicator? I’ll
consider it.
The Long Term NTSM indicator
ensemble is mixed, but remained HOLD: VIX is Bullish; VOLUME is bearish;
SENTIMENT & PRICE are hold.
The Index is now 1% above its 50-dMA. Can it remain above
its 50-dMA? Should I care? Probably not, unless the indicators make major
shifts.
I remain a Bear.
BEST ETFs - MOMENTUM ANALYSIS:
TODAY’S RANKING OF 15 ETFs
(Ranked Daily)
The top ranked ETF receives
100%. The rest are then ranked based on their momentum relative to the leading ETF.

http://navigatethestockmarket.blogspot.com/p/exchange-traded-funds-etf-ranking.html
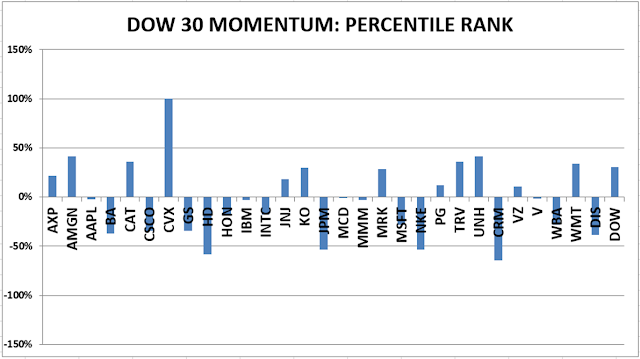
BEST DOW STOCKS - TODAY’S MOMENTUM
RANKING OF THE DOW 30 STOCKS (Ranked Daily)
Here’s the revised DOW 30 and
its momentum analysis. The top ranked stock receives 100%. The rest are then
ranked based on their momentum relative to the leading stock.
https://navigatethestockmarket.blogspot.com/p/a-system-for-trading-dow-30-stocks-my_8.html
TUESDAY MARKET INTERNALS (NYSE
DATA)
My basket of Market Internals reversed back to SELL. I’d need to see
this indicator in the green before I get back in the markets in a meaningful
way.
Market Internals are a decent
trend-following analysis of current market action, but should not be used alone
for short term trading. They are usually right, but they are often late. They are most useful when they diverge from
the Index.
My stock-allocation in the
portfolio is now about 35% invested in stocks. This is below my “normal” fully
invested stock-allocation of 50%.
I trade about 15-20% of the
total portfolio using the momentum-based analysis I provide here. If I can see
a definitive bottom, I’ll add a lot more stocks to the portfolio using an
S&P 500 ETF.
You may wish to have a higher
or lower % invested in stocks depending on your risk tolerance. 50% is a
conservative position that I consider fully invested for most retirees.
As a general rule, some
suggest that the % of portfolio invested in the stock market should be one’s
age subtracted from 100. So, a
30-year-old person would have 70% of the portfolio in stocks, stock mutual
funds and/or stock ETFs. That’s ok, but
for older investors, I usually don’t recommend keeping less than 50% invested
in stocks (as a fully invested position) since most people need some growth in
the portfolio to keep up with inflation.