“Trade what you see; not what you think.” – The Old Fool,
Richard McCranie, trader extraordinaire.
“Faced with a combination of record speculative extremes
and deteriorating speculative conditions, investors may want to remember that
the best time to panic is before everyone else does.” – John Hussman, Phd.

Political Comment from...
https://michaelpramirez.com/index.html
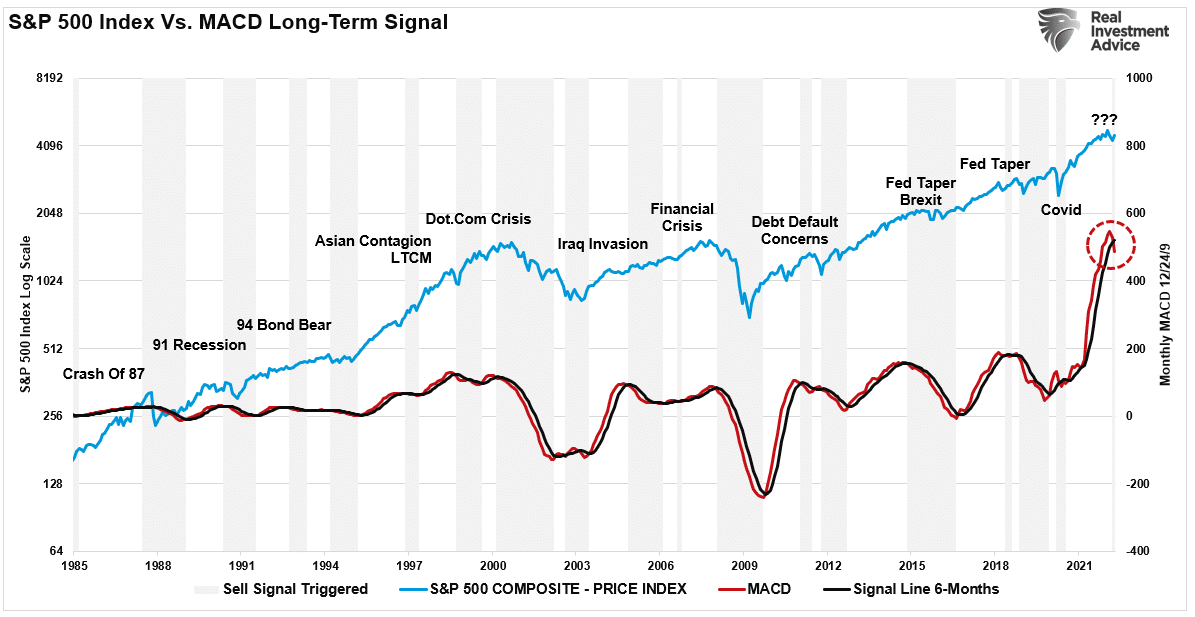
BEAR MARKET LURKING? (RIA)
“...from a purely technical perspective, the monthly
moving average convergence divergence indicator (MACD) also rings a significant
warning bell. The chart below measures the difference between the 12 and
24-month moving averages. When that line crosses below the 6-month signal line,
such suggests the market is at risk.” – Lance Roberts.

https://realinvestmentadvice.com/is-a-bear-market-lurking/
2 RUSSIAN OLIGARCHS FOUND DEAD ONE DAY APART (Zerohedge)
“The bodies of two Russian oligarchs were found dead
alongside their wives and children just one day apart, according to a handful of
media reports...Investigators said in their statement that they believe Avayev
shot his wife and daughter, and then himself. The second oligarch was found
killed in Spain, some 2,000 miles away. His name was Sergei Protosenya and he
was found stabbed to death with his wife and daughter.” Story at...
https://www.zerohedge.com/political/2-russian-oligarchs-found-dead-just-one-day-apart
While the Russian “press” implies these were murder
suicide cases, my guess is that it does not pay to piss off Vladimir Putin.
MARKET REPORT / ANALYSIS
-Monday the S&P 500 rose about 0.6% to 4296.
-VIX dipped about 4% to 27.02.
-The yield on the 10-year Treasury rose to 2.904%.
PULLBACK DATA:
If the correction has ended:
-Drop from Top: 13% (Avg.= 13% for non-crash pullbacks)
-Days from Top to Bottom: 48-days. (Avg= 30 days top to
bottom for corrections <10%; 60 days top to bottom for larger, non-crash
pullbacks)
Currently:
If the correction has not ended:
Days since top: 77 (Avg= 60 days top to bottom for
>10% non-crash pullbacks)
Drop from Top: Now 10.4%. Max at close: 13%
The S&P 500 is 4.5% BELOW its 200-dMA & 2.5%
BELOW its 50-dMA.
*We can’t call the end of the correction until the S&P
500 makes a new high. If it makes a new low, then the correction has obviously
not ended.
TODAY’S COMMENT:
Was today a Turn-around Tuesday on Monday? Probably not. The
S&P 500 experienced Statistically Significant days on Thursday and Friday
so a bounce was not surprising. I would be very surprised if the S&P 500
does not retest the 4171 low.
Today, the daily sum of 20 Indicators dropped from -3 to
-5 (a positive number is bullish; negatives are bearish); the 10-day smoothed
sum that smooths the daily fluctuations remained -20 (The trend direction is
more important than the actual number for the 10-day value.) These numbers
sometimes change after I post the blog based on data that comes in late. Most
of these 20 indicators are short-term so they tend to bounce around a lot.
The Long Term NTSM indicator
remained HOLD: VOLUME is bearish; VIX, SENTIMENT & PRICE are hold.
As previously noted, if a test of the 2171 low is
successful and the S&P 500 rebounds to a new-high, it would be a very
unusual correction to have lasted so long with only a 13% maximum drop from the
top. I am concerned that this could mean that the correction could go much
lower to match up with previous long corrections – say 20%? This isn’t a
prediction – just a worry. Only time
will tell...
I remain a Bear, but we’ll see what happens at the retest
of the low, assuming the S&P 500 get’s there.
BEST ETFs - MOMENTUM ANALYSIS:
TODAY’S RANKING OF 15 ETFs
(Ranked Daily)
The top ranked ETF receives
100%. The rest are then ranked based on their momentum relative to the leading ETF.

http://navigatethestockmarket.blogspot.com/p/exchange-traded-funds-etf-ranking.html
BEST DOW STOCKS - TODAY’S MOMENTUM
RANKING OF THE DOW 30 STOCKS (Ranked Daily)
Here’s the revised DOW 30 and
its momentum analysis. The top ranked stock receives 100%. The rest are then
ranked based on their momentum relative to the leading stock.

https://navigatethestockmarket.blogspot.com/p/a-system-for-trading-dow-30-stocks-my_8.html
MONDAY MARKET INTERNALS (NYSE
DATA)

Market Internals are a decent
trend-following analysis of current market action, but should not be used alone
for short term trading. They are usually right, but they are often late. They are most useful when they diverge from
the Index.
My stock-allocation in the
portfolio is now about 35% invested in stocks. This is below my “normal” fully
invested stock-allocation of 50%.
I trade about 15-20% of the
total portfolio using the momentum-based analysis I provide here. If I can see
a definitive bottom, I’ll add a lot more stocks to the portfolio using an
S&P 500 ETF.
You may wish to have a higher
or lower % invested in stocks depending on your risk tolerance. 50% is a
conservative position that I consider fully invested for most retirees.
As a general rule, some
suggest that the % of portfolio invested in the stock market should be one’s
age subtracted from 100. So, a
30-year-old person would have 70% of the portfolio in stocks, stock mutual
funds and/or stock ETFs. That’s ok, but
for older investors, I usually don’t recommend keeping less than 50% invested
in stocks (as a fully invested position) since most people need some growth in
the portfolio to keep up with inflation.