"Here’s the situation. And when it comes to the
gas prices, we’re going through an incredible transition that is taking place
that, God willing, when it’s over, we’ll be stronger and the world will be
stronger and less reliant on fossil fuels when this is over." - President Joe Biden.
When it’s over? “Clueless Joe” seems to think high gas
prices will solve the transition to fossil fuels in short order. It’s not that simple: “...replacing over 3,000
fossil-fuel power plants and millions of internal-combustion vehicles would
require thousands of new factories, and cost trillions of dollars. It also will
take at least a few generations.” - Emeritus Prof. Peter Z. Grossman, Butler
University, Indianapolis.
FOMC MINUTES (CNBC)
“Federal Reserve officials earlier this month stressed
the need to raise interest rates quickly and possibly more than markets
anticipate to tackle a burgeoning inflation problem, minutes from their meeting
released Wednesday showed. Not only did policymakers see the need to increase
benchmark borrowing rates by 50 points, but they also said similar hikes likely
would be necessary at the next several meetings.” Story at...
https://www.cnbc.com/2022/05/25/fed-minutes-may-2022.html
DURABLE ORDERS
“Orders at U.S. factories for long-lasting goods inched
slightly higher in April but came in below expectations as manufacturers
confronted a worsening supply-chain crisis that continued to weigh on business
investment. Bookings for all durable goods – products that are intended to last
at least three years – rose 0.4% last month...” Story at...
https://www.foxbusiness.com/economy/us-durable-goods-orders-rise-less-than-expected-april
EIA CRUDE INVENTORIES (EIA)
“U.S. commercial crude oil inventories (excluding those
in the Strategic Petroleum Reserve) decreased by 1.0 million barrels from the
previous week. At 419.8 million barrels, U.S. crude oil inventories are about
14% below the five year average for this time of year.” Press release at...
https://ir.eia.gov/wpsr/wpsrsummary.pdf
EVIDENCE INCREASING THAT THE MARKETS ARE BOTTOMING
(Heritage Capital)
“...the stock market continues the bottoming process much
like it did in the 13 days leading up to the COVID crash bottom on March 23,
2020...Plainly and directly put, stocks are supposed to rally and not make new
lows for the foreseeable future. The stars are aligning properly and the odds
have increased. If you want confirmation, watch for the major stock market
indices to close above last week’s highest point. If I am correct, the stock
market should bounce 7-12% into the summer before the next opportunity for a
fresh leg lower comes.” – Paul Schatz, President, heritage Capital. Commentary
at...
https://investfortomorrow.com/blog/lots-of-increasing-evidence-that-stocks-are-bottoming-for-now/
Nice to see that someone agrees with me. I should have
read this before I posted yesterday – I wouldn’t have needed to work so hard
reviewing data!
MARKET REPORT / ANALYSIS
-Wednesday the S&P 500 rose about 1% to 3979.
-VIX fell about 4% to 28.37.
-The yield on the 10-year Treasury slipped to 2.751%.
PULLBACK DATA:
-Drop from Top: 17.1% as of today. 18.7% max. (Avg.= 13%
for non-crash pullbacks)
-Days from Top to Bottom: 99-days. (Avg= 30 days top to
bottom for corrections <10%; 60 days top to bottom for larger, non-crash
pullbacks)
The S&P 500 is 10.8% BELOW its 200-dMA & 7.2%
BELOW its 50-dMA.
*I won’t call the correction over until the S&P 500
makes a new-high; however, we hope to be able to call the bottom when we see
it...and... we did call the market a trading “Buy” one day after the recent
trading-bottom on 12 May...
MY TRADING POSITIONS:
QQQ*
UWM*
XLE
DOW
*Sell when the markets make it to the 50-dMA.
TODAY’S COMMENT:
I wrote yesterday that “I am not going to panic over my
trades, yet...still waiting for that rally.” I think the rally is here, though
it probably won’t be straight up. Let’s
hope the FOMO Crowd (Fear-of-Missing-Out) buys into the “bottom-is-in” talk
that is bound to show up.
Indicators are improving so much that I am modifying my
sell point. Earlier I had said that I would sell the rally when I saw signs of markets
being overbought. That’s here already.
The overbought/oversold (A/D) ratio is now overbought. The 10-day percentage
of advancing issues was 56% today, up from 40% just 6 sessions ago. As a
result, I will use the 50-dMA as a likely sell point. It’s now 4288.
Today, the daily sum of 20 Indicators improved from +10
to +11 (a positive number is bullish; negatives are bearish); the 10-day
smoothed sum that smooths the daily fluctuations improved from +39 to +53. (The
trend direction is more important than the actual number for the 10-day value.)
These numbers sometimes change after I post the blog based on data that comes
in late. Most of these 20 indicators are short-term so they tend to bounce
around a lot.
LONG-TERM INDICATOR: The Long
Term NTSM indicator was HOLD: VIX is bearish; SENTIMENT, VOLUME and PRICE are
hold. 45 days out of the last 100 have
been up-days; that leans bullish.
I am cautiously Bullish in the short-term and Bearish
longer-term. I expect a rally in the 7-9% range. Around 4300 is as good a
target as any: it would be a 50% retracement and it is also currently close to
the 50-dMA.
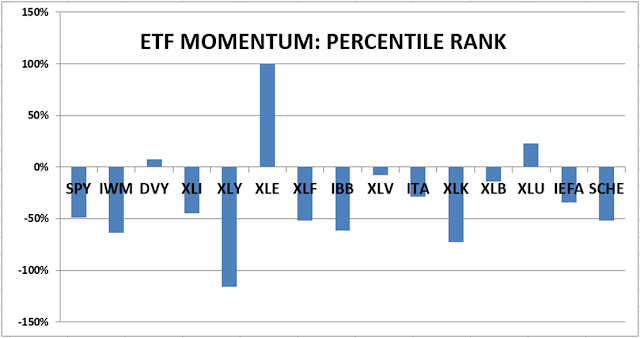
BEST ETFs - MOMENTUM ANALYSIS:
TODAY’S RANKING OF 15 ETFs
(Ranked Daily)
The top ranked ETF receives
100%. The rest are then ranked based on their momentum relative to the leading ETF.
http://navigatethestockmarket.blogspot.com/p/exchange-traded-funds-etf-ranking.html
BEST DOW STOCKS - TODAY’S MOMENTUM
RANKING OF THE DOW 30 STOCKS (Ranked Daily)
Here’s the revised DOW 30 and
its momentum analysis. The top ranked stock receives 100%. The rest are then
ranked based on their momentum relative to the leading stock.

https://navigatethestockmarket.blogspot.com/p/a-system-for-trading-dow-30-stocks-my_8.html
WEDNESDAY MARKET INTERNALS
(NYSE DATA)

Market Internals are a decent
trend-following analysis of current market action, but should not be used alone
for short term trading. They are usually right, but they are often late. They are most useful when they diverge from
the Index.
My stock-allocation in the
portfolio is now roughly 45% invested in stocks, but some percentage includes
trading-positions that I will exit if a rally fails to materialize. This is
slightly below my “normal” fully invested stock-allocation of 50%.
I trade about 15-20% of the
total portfolio using the momentum-based analysis I provide here. If I can see
a definitive bottom, I’ll add a lot more stocks to the portfolio using an
S&P 500 ETF.
You may wish to have a higher
or lower % invested in stocks depending on your risk tolerance. 50% is a
conservative position that I consider fully invested for most retirees.
As a general rule, some
suggest that the % of portfolio invested in the stock market should be one’s
age subtracted from 100. So, a
30-year-old person would have 70% of the portfolio in stocks, stock mutual
funds and/or stock ETFs. That’s ok, but
for older investors, I usually don’t recommend keeping less than 50% invested
in stocks (as a fully invested position) since most people need some growth in
the portfolio to keep up with inflation.