“Trade what you see; not what you think.” – The Old Fool,
Richard McCranie, trader extraordinaire.
“Faced with a combination of record speculative extremes
and deteriorating speculative conditions, investors may want to remember that
the best time to panic is before everyone else does.” – John Hussman, Phd.
JOBLESS CLAIMS (Baton Rouge Business Report)
“The number of Americans applying for jobless aid ticked
up slightly last week but the total number of Americans collecting benefits
remains at its lowest level in more than five decades.
Applications for unemployment benefits rose by 1,000 to
203,000 for the week ending May 7...” Story at...
https://www.businessreport.com/economy/us-initial-jobless-claims-rise-slightly
PRODUCER PRICE INDEX CORE PPI (CNBC)
“Prices at the wholesale level accelerated further in
April, part of a broader inflation problem persisting through the U.S. economy,
the Bureau of Labor Statistics reported Thursday. The producer
price index, which tracks how much manufacturers get for products at
their initial sale, rose 0.5% on the month and 11% from a year ago... Excluding
food, energy and trade services, core PPI rose 0.6% in April and 6.9% from a
year ago...” Story at...
MARKET REPORT / ANALYSIS
-Thursday the S&P 500 fell about 0.1% to 3930.
-VIX dropped about 2% to 31.77.
-The yield on the 10-year Treasury slipped to 2.865%.
PULLBACK DATA:
-Drop from Top: 18.1% as of today. 18.1% max. (Avg.= 13%
for non-crash pullbacks)
-Days from Top to Bottom: 90-days. (Avg= 30 days top to
bottom for corrections <10%; 60 days top to bottom for larger, non-crash
pullbacks)
The S&P 500 is 12.3% BELOW its 200-dMA & 9.4%
BELOW its 50-dMA.
*We can’t be sure that the correction is over until the
S&P 500 makes a new-high; however, we hope to be able to call the bottom
when we see it.
TODAY’S COMMENT:
Volume on the NYSE was higher today than it has been in
the last 2 months. That suggests 3 things: (1) increasing fear (2) no bottom
yet (3) and finally, perhaps we won’t have to wait too much longer for the big wash
out that would signal a short-term bottom.
Importantly, I don’t think that any “bottom” we see in
the near term will prove to be the final bottom. This downturn is looking more like
a major crash is underway.
I don’t see that this bear
market is going to end until inflation begins to act better; the FED is accommodative;
and recession questions are answered.
Today, the daily sum of 20 Indicators improved from -3 to
zero (a positive number is bullish; negatives are bearish); the 10-day smoothed
sum that smooths the daily fluctuations improved from -11 to -8. (The trend
direction is more important than the actual number for the 10-day value.) These
numbers sometimes change after I post the blog based on data that comes in
late. Most of these 20 indicators are short-term so they tend to bounce
around a lot.
LONG-TERM INDCATOR: The Long
Term NTSM indicator was SELL: VOLUME & VIX are bearish; PRICE &
SENTIMENT are hold. 45 days out of the
last 100 have been up-days; that leans bullish.
The SELL signal now doesn’t
mean much. The important sell-signal was 14 January. For now, it looks like we will
have a significant bounce soon, but as I noted above, I don’t see that this
bear market is going to end even if we do have a significant bounce from current
levels.
I’m Bearish. I’ve seen no confirmation of a low by the
markets and no actionable bottom signs in my analysis.
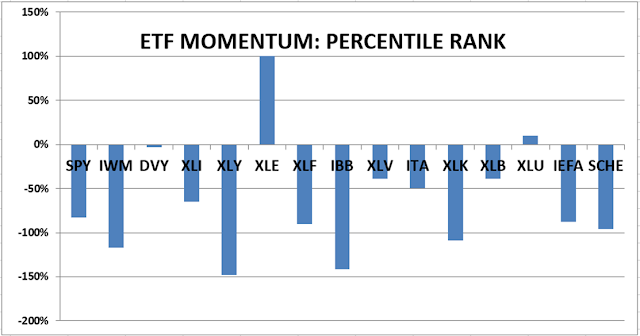
BEST ETFs - MOMENTUM ANALYSIS:
TODAY’S RANKING OF 15 ETFs
(Ranked Daily)
The top ranked ETF receives
100%. The rest are then ranked based on their momentum relative to the leading ETF.
http://navigatethestockmarket.blogspot.com/p/exchange-traded-funds-etf-ranking.html
My only current trading
position is in the Energy XLE-ETF.
BEST DOW STOCKS - TODAY’S MOMENTUM
RANKING OF THE DOW 30 STOCKS (Ranked Daily)
Here’s the revised DOW 30 and
its momentum analysis. The top ranked stock receives 100%. The rest are then
ranked based on their momentum relative to the leading stock.

https://navigatethestockmarket.blogspot.com/p/a-system-for-trading-dow-30-stocks-my_8.html
THURSDAY MARKET INTERNALS (NYSE
DATA)

Market Internals are a decent
trend-following analysis of current market action, but should not be used alone
for short term trading. They are usually right, but they are often late. They are most useful when they diverge from
the Index.
My stock-allocation in the
portfolio is now about 35% invested in stocks. This is below my “normal” fully
invested stock-allocation of 50%.
I trade about 15-20% of the
total portfolio using the momentum-based analysis I provide here. If I can see
a definitive bottom, I’ll add a lot more stocks to the portfolio using an
S&P 500 ETF.
You may wish to have a higher
or lower % invested in stocks depending on your risk tolerance. 50% is a
conservative position that I consider fully invested for most retirees.
As a general rule, some
suggest that the % of portfolio invested in the stock market should be one’s
age subtracted from 100. So, a
30-year-old person would have 70% of the portfolio in stocks, stock mutual
funds and/or stock ETFs. That’s ok, but
for older investors, I usually don’t recommend keeping less than 50% invested
in stocks (as a fully invested position) since most people need some growth in
the portfolio to keep up with inflation.