“Trade what you see; not what you think.” – The Old Fool,
Richard McCranie, trader extraordinaire.
“Faced with a combination of record speculative extremes
and deteriorating speculative conditions, investors may want to remember that
the best time to panic is before everyone else does.” – John Hussman, Phd.
ALLIGATOR JAWS (The Felder Report)

https://thefelderreport.com/2022/05/18/an-epic-set-of-alligator-jaws-part-deux/
MARKET REPORT / ANALYSIS
-Monday the S&P 500 rose about 1.9% to 3974.
-VIX slipped about 3% to 28.48.
-The yield on the 10-year Treasury rose to 2.854%.
PULLBACK DATA:
-Drop from Top: 17.2% as of today. 18.7% max. (Avg.= 13%
for non-crash pullbacks)
-Days from Top to Bottom: 97-days. (Avg= 30 days top to
bottom for corrections <10%; 60 days top to bottom for larger, non-crash
pullbacks)
The S&P 500 is 11% BELOW its 200-dMA & 7.5% BELOW
its 50-dMA.
*I won’t call the correction over until the S&P 500
makes a new-high; however, we hope to be able to call the bottom when we see
it...and... we did call the market a trading “Buy” one day after the recent
trading bottom on 12 May...
MY TRADING POSITIONS:
QQQ*
UWM*
XLE
DOW
*Sell when the markets are overbought or if the bounce
makes it to the 50-dMA. As always, there is no guarantee that markets will get anywhere near that high.
TODAY’S COMMENT:
Demark Indicators and the Demark counts are a proprietary
system for market timing available to subscribers of Demark Analytics at....
On Thursday of
last week, a Demark count pattern of 9 followed by 13 was completed. That has
often signaled selling exhaustion and a reversal to the upside in the markets.
It was accurate at bottoms in 2011, 2016, 2018, and in the coronavirus bottom
in 2020, but that may be overly optimistic. In previous cases there were policy
pivots by the Fed or European Central Banks that were made at those bottoms.
This time the Fed is not going to pivot to a bullish position – they are
committed to continuing rate hikes and balance sheet reductions.
For more detail, listen to market commentary by Chris
Ciavacco at...
https://www.youtube.com/watch?v=6ITErIBqOzc
Chris just says keep an open mind to any move. Markets
are at critical levels.
My opinion is that with Sentiment, volume-clues,
improvements in New-high/new-low data, all suggesting a counter-trend rally, it
would not be a surprise to see a rally “lasting several weeks to several
months.” As Chris warns, markets may
also fail, so Mondays’ action is critical.
Monday, we got the follow thru we had hoped for. Today
was the first day since 13 April that the 10-day moving average of advancing
issues was more than 50%. In plain English, more than half of the issues on the
NYSE have been up in the last 10-days. My Volume indicator, a variant of
On-Balance-Volume, also bounced up into the neutral zone. It had been bearish
for a month. Sentiment has been so bearish that it is bullish, though I expect
it to switch to neutral tonight. Breadth MACD also made a bullish crossover. So
far so good.
Four days ago, all 30 Dow stocks were down; Thursday, 20%
were up; Friday, 53% were up. Today, 90% were up. So far so good! - Lot’s of
green shoots.
Today, the daily sum of 20 Indicators improved from -1 to
+10 (a positive number is bullish; negatives are bearish); the 10-day smoothed
sum that smooths the daily fluctuations improved from +18 to +30. (The trend
direction is more important than the actual number for the 10-day value.) These
numbers sometimes change after I post the blog based on data that comes in
late. Most of these 20 indicators are short-term so they tend to bounce
around a lot.
LONG-TERM INDICATOR: The Long Term
NTSM indicator was HOLD: VIX is bearish; SENTIMENT was bullish; VOLUME and PRICE
are hold. 44 days out of the last 100
have been up-days; that leans bullish.
I am cautiously Bullish in the short-term and Bearish
longer-term. I expect a rally in the 7-9% range. 4300 is as good a target as
any: it would be a 50% retracement and it is also currently the 50-dMA.
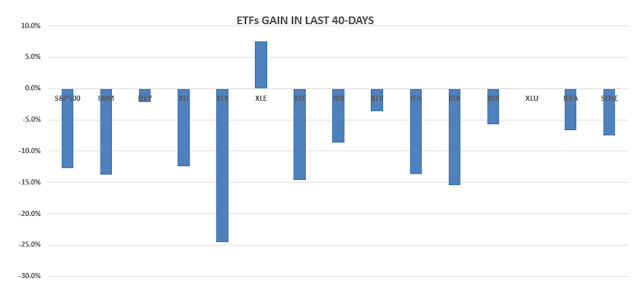
BEST ETFs - MOMENTUM ANALYSIS:
TODAY’S RANKING OF 15 ETFs
(Ranked Daily)
The top ranked ETF receives
100%. The rest are then ranked based on their momentum relative to the leading ETF.

http://navigatethestockmarket.blogspot.com/p/exchange-traded-funds-etf-ranking.html
BEST DOW STOCKS - TODAY’S MOMENTUM RANKING OF THE DOW 30 STOCKS (Ranked Daily)
Here’s the revised DOW 30 and
its momentum analysis. The top ranked stock receives 100%. The rest are then
ranked based on their momentum relative to the leading stock.

https://navigatethestockmarket.blogspot.com/p/a-system-for-trading-dow-30-stocks-my_8.html

MONDAY MARKET INTERNALS (NYSE DATA)

Market Internals are a decent
trend-following analysis of current market action, but should not be used alone
for short term trading. They are usually right, but they are often late. They are most useful when they diverge from
the Index.
My stock-allocation in the
portfolio is now roughly 45% invested in stocks, but some percentage includes
trading-positions that I will exit if the rally fails. This is slightly below
my “normal” fully invested stock-allocation of 50%.
I trade about 15-20% of the
total portfolio using the momentum-based analysis I provide here. If I can see
a definitive bottom, I’ll add a lot more stocks to the portfolio using an
S&P 500 ETF.
You may wish to have a higher
or lower % invested in stocks depending on your risk tolerance. 50% is a
conservative position that I consider fully invested for most retirees.
As a general rule, some
suggest that the % of portfolio invested in the stock market should be one’s
age subtracted from 100. So, a
30-year-old person would have 70% of the portfolio in stocks, stock mutual
funds and/or stock ETFs. That’s ok, but
for older investors, I usually don’t recommend keeping less than 50% invested
in stocks (as a fully invested position) since most people need some growth in
the portfolio to keep up with inflation.