“Trade what you see; not what you think.” – The Old Fool,
Richard McCranie, trader extraordinaire.
“Faced with a combination of record speculative extremes
and deteriorating speculative conditions, investors may want to remember that
the best time to panic is before everyone else does.” – John Hussman, Phd.
HOUSING STARTS / PERMITS (CNN.com)
“The number of housing starts fell for the second month
in a row in May, dropping 14.4% from April and 3.5% from the year before... Applications
to purchase new homes in May fell 4% from April, and 5% from a year ago,
according to the Mortgage Banker’s Association.” Story at...
https://www.cnn.com/2022/06/16/homes/us-housing-starts-new-home-building/index.html
JOBLESS CLAIMS (YahooFinance)
“Initial jobless claims ticked down last week, but were
higher than forecast, as investors monitor the labor market for potential signs
of a slowdown. First-time filings for unemployment insurance in the U.S.
totaled 229,000 for the week ended June 11...” Story at...
https://finance.yahoo.com/news/jobless-claims-june-16-2022-123826696.html
PHILADELPHIA FED INDEX (RTTnews)
“Manufacturing activity in the Philadelphia region saw a
modest contraction in the month of June, according to a report released by the
Federal Reserve Bank of Philadelphia on Thursday. The Philly Fed said its
current general activity index dropped to a negative 3.3 in June from a
positive 2.6 in May...” Story at...
https://www.rttnews.com/3291158/philly-fed-index-indicates-first-contraction-since-may-2020.aspx
IS $6 DOLLAR GASOLINE NEXT? (WSJ-Editorial Page)
“In a remarkable and threatening letter to oil and gas
CEOs this week, Mr. Biden seems stunned to learn that prices rise when supply
doesn’t meet demand...At least he’s finally noticed the dearth of refining
capacity to process crude, which some of us have warned about for years. The
U.S. has lost about one million barrels a day of refining capacity in the
pandemic...A major culprit is U.S. government policy. Some older refineries
have closed because companies couldn’t justify spending on upgrades as
government forces a shift from fossil fuels. They also have to account for the
Environmental Protection Agency’s tighter permitting requirements—the agency
recently challenged a permit for an Indiana refinery—and steeper biofuel
mandates...
...Chevron CEO
Mike Wirth said recently that refineries are shutting down or being repurposed
for renewable fuels because “the stated policy of the U.S. government is to
reduce demand for the products that refiners produce.” When companies are told
that demand for their product will become obsolete, it’s no surprise that they
don’t invest in supply.” WS
My cmt: How does an oil company finance a new billion-dollar
refinery? What bank would loan the money to build a facility that the Government
claims will be obsolete in 20 years?
MARKET REPORT / ANALYSIS
-Thursday the S&P 500 fell about 3.3% to 3667.
-VIX rose about 11% to 29.62.
-The yield on the 10-year Treasury slipped to 3.289%
PULLBACK DATA:
-Drop from Top: 23.6% as of today. 23.6% max. (Avg.= 13%
for non-crash pullbacks)
-Days from Top to Bottom: 114-days. (Avg= 30 days top to
bottom for corrections <10%; 60 days top to bottom for larger, non-crash
pullbacks)
The S&P 500 is 17.1% BELOW its 200-dMA & 11.3%
BELOW its 50-dMA.
*I won’t call the correction over until the S&P 500 makes
a new-high; however, we hope to be able to call the bottom when we see it.
MY TRADING POSITIONS:
SH – I took a small position
in SH-ProShares Short S&P500. I’ll add to it if the markets go significantly
higher.
Carter Worth (CNBC contributor) predicted about a 10%
rally from today’s close based on the charts.
XLE - I took profits in XLE
today, but I admit that I held it too long and missed a bigger gain. Still,
better a gain than a loss.
TODAY’S COMMENT:
I wrote the following Wednesday night:
“So far, this week has produced the following data:
-The 30-year fixed rate mortgage was 6.3% yesterday. It was in the low 3’s earlier in the year. This
number will get worse and cause major problems for housing.
-Retail sales were down 3% in May.
-Auto sales plunged.
-NY Fed's Empire State Manufacturing Survey dropped to
-11.60 in May from 24.60 in April. A negative number signals worsening
conditions.
We can’t feel good about the future for the stock market.”
Looks like investors woke up today. Now, markets are pricing in a recession. Energy is falling because a recession will
cut demand (as will current high prices).
There was no follow-thru from yesterday’s buying. While
technical indicators are suggesting a bounce higher, it is not clear that we’ll
see much of a bounce. Markets can fall a
lot even though they are “oversold”. Still, my Bottom Indicator ensemble was +9
indicating there are 9 indicators calling for a bottom. The last time there was a number that high
was December 2018 at the bottom of a 20% correction. This isn’t a bottom, but
it may be signaling a bounce.
I added a small position in ProShares Short S&P500
(SH). It is a non-leveraged short position that I would feel comfortable
holding for a longer period. This is a trading position, but I am not net short
on the total portfolio. That just seems too risky now – the unknowns could
resolve to the bullish side – it may not seem likely now, but it will happen,
eventually. I’ll add more if we have a bounce.
As noted earlier, the charts are suggesting a final low
at least in the 3300-3500 range.
Just for kicks I looked up Apple’s PE from 3 years ago.
It was 15.6. Today, it’s PE is 21.2. Today’s PE is 36% higher than it was 3
years ago. Could Apple fall another 36%? It’s possible; that is not a
prediction – just an observation.
Today, the daily sum of 20 Indicators IMPROVED from -6 to
-1 (a positive number is bullish; negatives are bearish); the 10-day smoothed
sum that smooths the daily fluctuations dropped from +53 to +38. (The trend
direction is more important than the actual number for the 10-day value.) These
numbers sometimes change after I post the blog based on data that comes in
late. Most of these 20 indicators are short-term so they tend to bounce
around a lot.
LONG-TERM INDICATOR: The Long
Term NTSM indicator improved to HOLD: SENTIMENT is bullish; PRICE is neutral;
VOLUME and VIX are bearish.
I’m a Bear, but I expect a bounce of some kind soon.
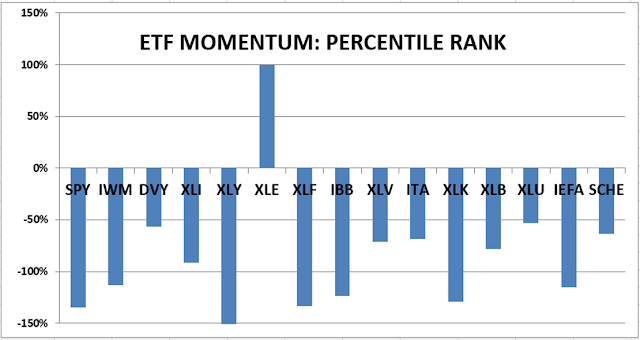
BEST ETFs - MOMENTUM ANALYSIS:
TODAY’S RANKING OF 15 ETFs
(Ranked Daily)
The top ranked ETF receives
100%. The rest are then ranked based on their momentum relative to the leading ETF.
http://navigatethestockmarket.blogspot.com/p/exchange-traded-funds-etf-ranking.html
BEST DOW STOCKS - TODAY’S MOMENTUM
RANKING OF THE DOW 30 STOCKS (Ranked Daily)
Here’s the revised DOW 30 and
its momentum analysis. The top ranked stock receives 100%. The rest are then
ranked based on their momentum relative to the leading stock.

https://navigatethestockmarket.blogspot.com/p/a-system-for-trading-dow-30-stocks-my_8.html
THURSDAY MARKET INTERNALS
(NYSE DATA)

Market Internals are a decent
trend-following analysis of current market action, but should not be used alone
for short term trading. They are usually right, but they are often late. They are most useful when they diverge from
the Index.
My stock-allocation in the
portfolio is now roughly 30% invested in stocks.
I trade about 15-20% of the
total portfolio using the momentum-based analysis I provide here. If I can see
a definitive bottom, I’ll add a lot more stocks to the portfolio using an
S&P 500 ETF.
You may wish to have a higher
or lower % invested in stocks depending on your risk tolerance. 50% is a
conservative position that I consider fully invested for most retirees.
As a general rule, some
suggest that the % of portfolio invested in the stock market should be one’s
age subtracted from 100. So, a
30-year-old person would have 70% of the portfolio in stocks, stock mutual
funds and/or stock ETFs. That’s ok, but
for older investors, I usually don’t recommend keeping less than 50% invested
in stocks (as a fully invested position) since most people need some growth in
the portfolio to keep up with inflation.