“Trade what you see; not what you think.” – The Old Fool,
Richard McCranie, trader extraordinaire.
“Faced with a combination of record speculative extremes
and deteriorating speculative conditions, investors may want to remember that
the best time to panic is before everyone else does.” – John Hussman, Phd.
EIA CRUDE INVENTORIES (EIA)
“U.S. commercial crude oil inventories (excluding those
in the Strategic Petroleum Reserve) increased by 2.0 million barrels from the
previous week. At 416.8 million barrels, U.S. crude oil inventories are about
15% below the five-year average for this time of year. Total motor gasoline
inventories decreased by 0.8 million barrels last week and are about 10% below
the five-year average for this time of year.” Report at...
https://ir.eia.gov/wpsr/wpsrsummary.pdf
WHAT HAPPENS AFTER BACK-TO-BACK-TO-BACK 80% UP-VOLUME
DAYS? (Ciovacco Capital)
There were back-to-back-to-back 80% up-volume days 25
thru 27 May. That’s considered a very bullish sign. Even 2 in a row are bullish. Here’s a Table
from Chris Ciovacco that presents the returns after 3 in a row. It is mostly
bullish, but we note the crash year of 2009 is included in the data.

Charts and audio presentation at...
https://www.youtube.com/watch?v=mTFxTR8btjc&t=1685s
STOCKS PREDICTED TO RECLAIM ALL TIME HIGHS (CNBC)
“...in a recent note, Kolanovic [J.P. Morgan’s Marko
Kolanovic] speculated the [S&P 500] index would end the year around 4,800,
still on par with all-time highs hit on Jan. 4... “If we continue to see [the]
consumer especially on the services side holding up — which we do expect — then
we think investors will gradually come back into equity markets.” Kolanovic’s
top call is still energy,
a group he has been bullish on since 2019.” Story at...
https://www.cnbc.com/2022/06/07/150-oil-wont-cripple-economy-market-jp-morgans-marko-kolanovic.html
MARKET REPORT / ANALYSIS
-Wednesday the S&P 500 fell about 1.1% to 4116.
-VIX slipped about 0.3% to 23.96.
-The yield on the 10-year Treasury rose to 3.022%.
PULLBACK DATA:
-Drop from Top: 14.2% as of today. 18.7% max. (Avg.= 13%
for non-crash pullbacks)
-Days from Top to Bottom: 108-days. (Avg= 30 days top to
bottom for corrections <10%; 60 days top to bottom for larger, non-crash
pullbacks)
The S&P 500 is 7.4% BELOW its 200-dMA & 2.6%
BELOW its 50-dMA.
*I won’t call the correction over until the S&P 500
makes a new-high; however, we hope to be able to call the bottom when we see
it...and...we did call the market a trading “Buy” one day after the recent
trading-bottom on 12 May although that turned
out to be a little early.
MY TRADING POSITIONS:
SSO*
XLK*
UWM*
I’ll sell quickly if the rally appears to be failing.
XLE
DOW
TODAY’S COMMENT:
I think that we are now in a decline that will eventually
be called a crash (down 45-50% on major indices) and I don’t think that the
S&P 500 has yet seen a bottom. That
said, the indicators are now very bullish.
I mentioned Monday that analysis of the number of
advancing issues on the NYSE vs. the S&P 500 shows that advancing issues
are significantly ahead of the Index. That divergence suggests continued
improvement in the S&P 500. That divergence is now at levels not seen since
the end of the Coronavirus correction.
The catch is that Indicators can’t tell us how high the
markets will bounce or even if the Correction is over. There are no indicators that can. That’s why
there are so many different opinions from the talking heads on the financial
news networks. The correction could be over, it just doesn’t seem likely. The
FED, Inflation, Supply Constraints, China provocations and War in Ukraine seem
likely to create real problems in markets and the economy.
For now, I am playing a counter-trend rally that has been
kicked off by a number of bull-signs after a significant decline that exhausted
itself. My guess is that the rally could peak at the 200-dMA on the S&P
500, but it could aways fail at the 50-dMA.
More importantly, the markets could just keep going up. We won’t know until we get more information.
Today, the daily sum of 20 Indicators improved from +12
to +16 (a positive number is bullish; negatives are bearish); the 10-day
smoothed sum that smooths the daily fluctuations improved from +128 to +134.
(The trend direction is more important than the actual number for the 10-day
value.) These numbers sometimes change after I post the blog based on data that
comes in late. Most of these 20 indicators are short-term so they tend to
bounce around a lot.
LONG-TERM INDICATOR: The Long
Term NTSM indicator improved to BUY: PRICE & VOLUME are bullish; SENTIMENT and
VIX are neutral.
I am cautiously Bullish in the short-term and Bearish
longer-term. I am watching indicators closely since we need to sell when the
rally peaks (or close to it) .
BEST ETFs - MOMENTUM ANALYSIS:
TODAY’S RANKING OF 15 ETFs
(Ranked Daily)
The top ranked ETF receives
100%. The rest are then ranked based on their momentum relative to the leading ETF.
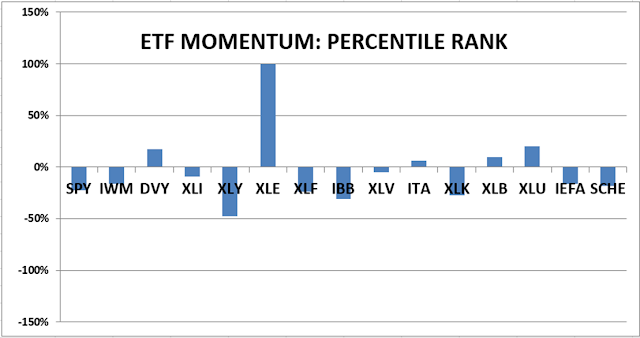
http://navigatethestockmarket.blogspot.com/p/exchange-traded-funds-etf-ranking.html
BEST DOW STOCKS - TODAY’S MOMENTUM
RANKING OF THE DOW 30 STOCKS (Ranked Daily)
Here’s the revised DOW 30 and
its momentum analysis. The top ranked stock receives 100%. The rest are then
ranked based on their momentum relative to the leading stock.

https://navigatethestockmarket.blogspot.com/p/a-system-for-trading-dow-30-stocks-my_8.html
WEDNESDAY MARKET INTERNALS
(NYSE DATA)

Market Internals are a decent trend-following analysis of current market action, but should not be used alone for short term trading. They are usually right, but they are often late. They are most useful when they diverge from the Index.
My stock-allocation in the
portfolio is now roughly 55% invested in stocks. This is slightly above my
“normal” fully invested stock-allocation of 50%. I am calling this defensive
because my current positions are trading positions – not long-term holds. We
need to be very vigilant now to avoid losses in future declines.
I trade about 15-20% of the
total portfolio using the momentum-based analysis I provide here. If I can see
a definitive bottom, I’ll add a lot more stocks to the portfolio using an
S&P 500 ETF.
You may wish to have a higher
or lower % invested in stocks depending on your risk tolerance. 50% is a
conservative position that I consider fully invested for most retirees.
As a general rule, some
suggest that the % of portfolio invested in the stock market should be one’s
age subtracted from 100. So, a
30-year-old person would have 70% of the portfolio in stocks, stock mutual
funds and/or stock ETFs. That’s ok, but
for older investors, I usually don’t recommend keeping less than 50% invested
in stocks (as a fully invested position) since most people need some growth in
the portfolio to keep up with inflation.