“Trade what you see; not what you think.” – The Old Fool, Richard McCranie, trader extraordinaire.
“The U.S. economy contracted for the second straight quarter from April to June, hitting a widely accepted rule of thumb for a recession, the Bureau of Economic Analysis reported Thursday. Gross domestic product fell 0.9% at an annualized pace for the period, according to the advance estimate.” Story at...
https://www.cnbc.com/2022/07/28/gdp-q2-.html
NBER (National Bureau of Economic Research) is the agency that determines when recessions start. They tend to do it after-the-fact. Has recession started? We don’t know.
“New applications for unemployment benefits held near the highest level of the year last week, a sign that the tight labor market is loosening. Initial jobless claims, a proxy for layoffs, fell 5,000 to a seasonally adjusted 256,000 in the week ended July 23 from the prior week’s upwardly revised level...The prior week’s reading was revised up by 10,000 and was the highest level of claims since November.” Story at...
https://www.wsj.com/articles/jobless-claims-hold-near-highest-level-of-the-year-11659013014
“...let me say that whether or not inflation is tamed, (I argue it is) Powell and the Fed will blink. I believe the unemployment rate is bottoming right here and right now. The economy created 372,000 new jobs in June and I do not think that number will be surpassed for the next 12-18 months. In all likelihood, a negative monthly print will be seen in Q4 2022 or Q1 2023. Now tell me; will Jay Powell continue to raise rate when the economy is losing jobs?” Commentary at...
https://investfortomorrow.com/blog/special-fed-update-pivot-on-the-way-no-recession-yet/
A Fed pivot (lowering rates or suspending rate hikes) would be very bullish.
“Morgan Stanley’s Mike Wilson believes stocks are on a collision course with more pain due to the economic slowdown. The firm’s chief U.S. equity strategist and chief investment officer said on CNBC’s “Fast Money” that investors should resist putting their money to work in stocks despite the market’s post-Fed-decision jump... Wilson is bracing for the S&P to fall below 3,636, the 52-week low hit last month...“We’re trying to give them [clients] a good risk-reward. Right now, the risk-reward, I would say, is about 10 to one negative,”” Story at...
https://www.cnbc.com/2022/07/27/market-jump-after-fed-hike-is-trap-morgan-stanley-warns-investors-.html
-Thursday the S&P 500 rose about 1.2% to 4072.
-VIX dipped about 4% to 22.33.
-The yield on the 10-year Treasury slipped to 2.676%. (Worried investors are buying Treasuries, driving down interest rates.)
-Drop from Top: 15.1% as of today. 23.6% max.
-Trading Days since Top: 142-days.
The S&P 500 is 6.3% Below its 200-dMA & closed 3.9% Above its 50-dMA. The 100-dMA is 4123.
*I won’t call the correction over until the S&P 500 makes a new-high; however, we hope to be able to call the bottom when we see it.
SH, short the S&P 500 ETF. I didn’t add any long positions – I hate chasing rallies.
...is not much different than yesterday...
I saw comments at Wednesday was a Blow-off Top. Nope. Volume was too low and of course today’s action moved the S&P 500 higher. So, we can ask again, “Was today was a Blow-off Top?” No. The only top indicator currently warning is Bollinger Bands. Bollinger Bands are overbought, but one top-indicator doesn’t drive the train. We also see that the overbought/oversold ratio is overbought, but that indicator is a very short-term indicator. Further, there were signs of increasing volume today. It was 15% above the monthly average while it had been 15% below trend just a week and a half ago.
BEST ETFs - MOMENTUM ANALYSIS:
TODAY’S RANKING OF 15 ETFs (Ranked Daily)

http://navigatethestockmarket.blogspot.com/p/exchange-traded-funds-etf-ranking.html
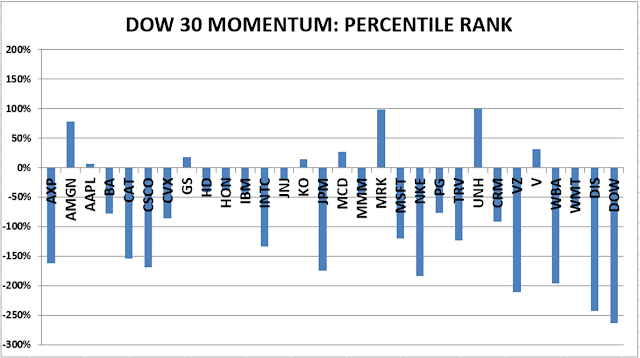
Here’s the revised DOW 30 and its momentum analysis. The top ranked stock receives 100%. The rest are then ranked based on their momentum relative to the leading stock.
https://navigatethestockmarket.blogspot.com/p/a-system-for-trading-dow-30-stocks-my_8.html
