“Trade what you see; not what you think.” – The Old Fool, Richard McCranie, trader extraordinaire.
“Existing-home sales declined for the fifth straight month to a seasonally adjusted annual rate of 5.12 million. Sales were down 5.4% from May and 14.2% from one year ago.” Report at...
https://www.nar.realtor/newsroom/existing-home-sales-slid-5-4-in-june
There was a low point for Coronavirus a year ago so the 14.2% drop in sales from a year earlier is not related to the virus. It is a huge drop. The housing market is a good recession indicator, but I am not an economist and I don’t know the metrics to predict what this means for recession probability. In a separate report, CNBC reported that mortgage demand hit a 22-year low last week. 22 years ago would be at the start of the dot.com crash and recession.
“U.S. commercial crude oil inventories (excluding those in the Strategic Petroleum Reserve) decreased by 0.4 million barrels from the previous week. At 426.6 million barrels, U.S. crude oil inventories are about 6% below the five year average for this time of year.” Report at...
https://ir.eia.gov/wpsr/wpsrsummary.pdf
Falling inventories suggest increased demand and rising prices.
-Wednesday the S&P 500 rose about 0.6% to 3960.
-VIX dropped about 3% to 23.88.
-The yield on the 10-year Treasury rose to 3.031%.
-Drop from Top: 17.4% as of today. 23.6% max.
-Trading Days since Top: 136-days.
The S&P 500 is 9.1% BELOW its 200-dMA & 1% ABOVE its 50-dMA.
*I won’t call the correction over until the S&P 500 makes a new-high; however, we hope to be able to call the bottom when we see it.
SH, short the S&P 500 ETF.
Bollinger Bands were indicating overbought today. Yesterday we saw a Bollinger Band Squeeze, suggesting a big breakout is coming, although the direction of the breakout is not clear. Given the overbought condition in Bollinger Bands, the breakout direction chances may be evenly split between up or down.

TODAY’S RANKING OF 15 ETFs (Ranked Daily)
My chart of this data is looking funky. The top four ETF ranking follows:
(1) IBB (2) XLV (3) XLU (4) ITA These are conservative, “investors-are-playing-defense,” leaders.
*For additional background on the ETF ranking system see NTSM Page at…
http://navigatethestockmarket.blogspot.com/p/exchange-traded-funds-etf-ranking.html
Here’s the revised DOW 30 and its momentum analysis. The top ranked stock receives 100%. The rest are then ranked based on their momentum relative to the leading stock.
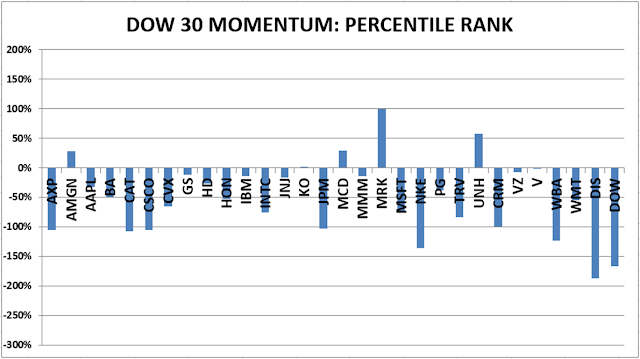
https://navigatethestockmarket.blogspot.com/p/a-system-for-trading-dow-30-stocks-my_8.html
