“Trade what you see; not what you think.” – The Old Fool,
Richard McCranie, trader extraordinaire.
EMPIRE STATE MANUFACTURING (Reuters)
“New York state manufacturing contracted sharply in January as orders collapsed and employment growth stalled, pointing to continued weakness in national factory activity, and little improvement was expected over the next six months...The New York Fed's "Empire State" index on current business conditions plummeted to -32.9 this month from -11.2 in December. That was the lowest level since May 2020 and the fifth worst reading in the survey's history.” Story at...
https://www.reuters.com/markets/us/new-york-state-manufacturing-collapses-monthly-survey-2023-01-17/
My cmt: Economists expected the contraction to slowdown, instead it accelerated.
STOCK MARKET LEGEND ISSUES BEAR WARNING (Fox Business)
“While [Peter Eliades] the Stockmarket Cycles publisher and editor was bullish [in October], he said on "Cavuto: Coast to Coast" Monday that he’s returning to his cage. "I'm returning to my cage again," Eliades told Cavuto. "I'm going to be called a vicious and ferocious growling bear."...Employers added 223,000 jobs in December, the Labor Department said in its monthly payroll report... The unemployment rate unexpectedly fell to 3.5%, a five-decade low. "That's one of the lowest readings in the last oh, gosh, 60 years. You just don't get down to 3.5% that often," Eliades said. "Except the problem is, it works exactly the way your instinct might tell you it would work: very low unemployment numbers are usually very bearish for the market." Story at...
Stock market legend issues ‘vicious and ferocious growling bear’ warning over US labor force (msn.com)
My cmt: As I noted recently, low unemployment can signal an overheated economy. If the Fed is hell bent on increasing unemployment, even though inflation is falling, this prediction could be correct. The issue is timing. We might see new highs in the markets before this prediction can be realized. At that point, we may consider whether this dire outcome is still is a possibility.
THEY’VE RULED OUT TAIL RISK (Hussman Funds)
“As of Friday, December 16, the S&P 500 Index is down -19.7% from the most speculative level of valuations in U.S. history – exceeding even the 1929 and 2000 extremes, based on the valuation measures we find best-correlated with actual subsequent market returns in cycles across history. The apparent shallowness of this loss isn’t a sign of “resilience.” Despite being nearly a year into what we expect to be a far deeper retreat, the relatively shallow loss isn’t even surprising. The same thing happened in the first year of each of the three deepest post-war stock market collapses: 2000-2002, 2007-2009, and 1973-74...For our part, our most reliable valuation measures imply negative 10-12 year market returns, and a potential market loss on the order of -60% from current levels over the completion of the present market cycle.” Commentary at...
https://www.hussmanfunds.com/comment/mc221219/
My cmt: While a crash from current market levels is possible, it seems unlikely at this point. Here are some other thoughts by Pros...
2023 OUTLOOK (Ciovacco
Management on YouTube)
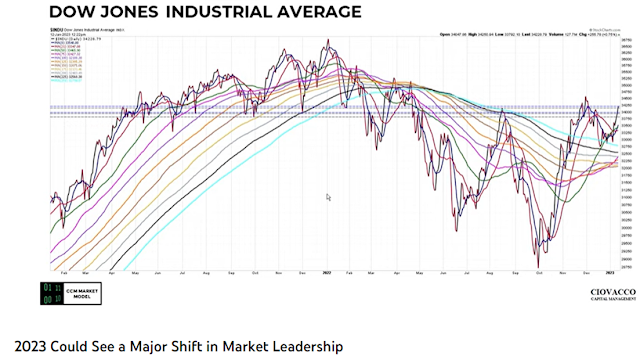 “A lot of good things are happening [in this chart]
including the price consolidating above the moving averages...This is different
than anything we’ve seen [during the pullback]...telling us there’s a higher
probability of [markets moving higher].” Chris Ciovacco, Ciovacco Management.
Narrated PowerPoint presentation at...
“A lot of good things are happening [in this chart]
including the price consolidating above the moving averages...This is different
than anything we’ve seen [during the pullback]...telling us there’s a higher
probability of [markets moving higher].” Chris Ciovacco, Ciovacco Management.
Narrated PowerPoint presentation at...
https://www.youtube.com/watch?v=Cao1nSHWvGo
My cmt: The presentation shows many charts improving thus indicating a higher probability of good things happening in the future. The charts were from Thursday. Friday, there were more bullish indications, most notably, the S&P 500 broke above its 200-day moving average.
3RD YEAR OF PRESIDENTIAL TERM IS SUPPOSED TO
BE BULLISH (McClellan Financial Publications)
“During a typical 4-year presidential term, the stock market tends to be flattish during the first 2 years...But third years are really consistently up, almost all of the time. The notable exceptions were 1931, when the world was in the middle of the Great Depression, and 1939, when the Wehrmacht was marching through Poland. Outside of conditions like those, the third year can usually be counted on to be an up year.” Commentary at...
https://www.mcoscillator.com/learning_center/weekly_chart/3rd_year_of_presidential_term_is_supposed_to_be_bullish/
MARKET REPORT / ANALYSIS
-Tuesday the S&P 500 dipped about 0.2% to 3991.
-VIX rose about 6% to 19.36.
-The yield on the 10-year Treasury rose to 3.549%.
PULLBACK DATA:
-Drop from Top: 16.8% as of today. 25.4% max (on a closing basis).
-Trading Days since Top: 260-days.
The S&P 500 is 0.3% ABOVE its 200-dMA & 1.8% ABOVE its 50-dMA.
*I won’t call the correction over until the S&P 500 makes a new-high; however, evidence suggests the bottom was in the 3600 area.
MY TRADING POSITIONS:
I am doing less trading now. You may do better watching the momentum charts rather than my moves.
XLK – Technology ETF.
SSO – 2x S&P 500. (My indicators are improving.)
XLE – Energy Sector ETF. Low PE; good Dividend; decent momentum.
BA – (Boeing) I am late on this one, but we’ll see.
XLY - Consumer Discretionary ETF.
SHY – Short term bonds. 30-day yield is 4.2%. (Trailing
1-year yield is 1.3%.) I’ll hold this, but if the market retests the lows, I’ll
sell it and buy stocks.)
TODAY’S COMMENT:

“Breadth thrusts have, for the most part, been the most
reliable market signal in the bull market from 2009 all the way up to 2021.” –
Chris Ciovacco. I use a Zweig Breadth Thrust that is bullish when there is a
rapid improvement in the percentage of stocks advancing over a given time
period. The graphic indicates 61 Breadth Thrust signals. Many of those signals are using other
methods of determining breadth thrusts. I only have 23 bullish Zweig Breadth Thrusts
since 2009. Still, I think the point is the same; breadth thrusts are good
indicators. Since we saw a Breadth Thrust last Thursday, it suggests good
things ahead for the markets, with a caution. No indicator is always right – we
saw a Breadth Thrust on 2 June 2022. While it marked a good bounce, it was
obviously not the bottom of this bear market. The S&P 500 fell another 13%
before bottoming in October. Further, it was followed by 2 negative Breadth
Thrusts a week later warning of more trouble ahead. There is no guarantee that October
will be the final bottom, but indicators are improving and a Breadth Thrust is
very bullish.
It looks like the Nasdaq Composite retested its lows at
the end of December and has bounced up sharply from there. The Nas was up 0.1%
today while the other major indices were all down. It might be time to add
more exposure to technology.
The S&P 500 is still overbought on the A/D Ratio so
we could see a bit of weakness, but I don’t expect much downside. The Buying
Pressure minus Selling Pressure is sloping upward now, a bullish sign. This indicator has been down for the last
month.
The S&P 500 closed above its 200-dMA for a second
consecutive day a good sign for the bulls.
Today, the daily sum of 20 Indicators improved from +13 to
+14 (a positive number is bullish; negatives are bearish); the 10-day smoothed
sum that smooths the daily fluctuations increased from +114 to 121. (The trend
direction is more important than the actual number for the 10-day value.) These
numbers sometimes change after I post the blog based on data that comes in
late. Most of these 20 indicators are short-term so they tend to bounce around
a lot.
LONG-TERM INDICATOR: The Long Term NTSM indicator
remained BUY: In a rare agreement, VOLUME, VIX, PRICE & SENTIMENT are all
positive.
“Looking good Billy Ray! Feeling good Lewis!”
(The important BUY in this indicator was on 21 October, 7-days after the bottom. The NTSM buy-signal was 27 September, based on improved internals at the retest low, about 2% before the bottom.)
Bottom line: I’m a BULL. I am over-invested in the markets.
I now have about 75% of the portfolio invested in stocks. (As a retiree, 50% invested in stocks is my “normal” portfolio.) As the rally ages, I’ll cut back toward a 50% stock allocation more suitable for my status as a retiree.
BEST ETFs - MOMENTUM ANALYSIS:
TODAY’S RANKING OF 15 ETFs (Ranked Daily)
ETF ranking follows:
 The top ranked ETF receives
100%. The rest are then ranked based on their momentum relative to the leading
ETF.
The top ranked ETF receives
100%. The rest are then ranked based on their momentum relative to the leading
ETF.
*For additional background on the ETF ranking system see NTSM Page at…
http://navigatethestockmarket.blogspot.com/p/exchange-traded-funds-etf-ranking.html

BEST DOW STOCKS - TODAY’S MOMENTUM RANKING OF THE DOW 30 STOCKS (Ranked Daily)
DOW 30 momentum ranking follows:
 The top ranked Stock receives
100%. The rest are then ranked based on their momentum relative to the leading Stock.
The top ranked Stock receives
100%. The rest are then ranked based on their momentum relative to the leading Stock.
For more details, see NTSM Page at…
https://navigatethestockmarket.blogspot.com/p/a-system-for-trading-dow-30-stocks-my_8.html

TUESDAY MARKET INTERNALS (NYSE DATA)

My basket of Market Internals remained BUY. (Market Internals are a decent trend-following analysis of current market action, but should not be used alone for short term trading. They are most useful when they diverge from the Index.)

...My current invested
position is about 75% stocks, including stock mutual funds and ETFs. I’m
usually about 50% invested in stocks.
I trade about 15-20% of the
total portfolio using the momentum-based analysis I provide here. If I can see
a definitive bottom, I’ll add a lot more stocks to the portfolio using an
S&P 500 ETF.
“New York state manufacturing contracted sharply in January as orders collapsed and employment growth stalled, pointing to continued weakness in national factory activity, and little improvement was expected over the next six months...The New York Fed's "Empire State" index on current business conditions plummeted to -32.9 this month from -11.2 in December. That was the lowest level since May 2020 and the fifth worst reading in the survey's history.” Story at...
https://www.reuters.com/markets/us/new-york-state-manufacturing-collapses-monthly-survey-2023-01-17/
My cmt: Economists expected the contraction to slowdown, instead it accelerated.
“While [Peter Eliades] the Stockmarket Cycles publisher and editor was bullish [in October], he said on "Cavuto: Coast to Coast" Monday that he’s returning to his cage. "I'm returning to my cage again," Eliades told Cavuto. "I'm going to be called a vicious and ferocious growling bear."...Employers added 223,000 jobs in December, the Labor Department said in its monthly payroll report... The unemployment rate unexpectedly fell to 3.5%, a five-decade low. "That's one of the lowest readings in the last oh, gosh, 60 years. You just don't get down to 3.5% that often," Eliades said. "Except the problem is, it works exactly the way your instinct might tell you it would work: very low unemployment numbers are usually very bearish for the market." Story at...
Stock market legend issues ‘vicious and ferocious growling bear’ warning over US labor force (msn.com)
My cmt: As I noted recently, low unemployment can signal an overheated economy. If the Fed is hell bent on increasing unemployment, even though inflation is falling, this prediction could be correct. The issue is timing. We might see new highs in the markets before this prediction can be realized. At that point, we may consider whether this dire outcome is still is a possibility.
“As of Friday, December 16, the S&P 500 Index is down -19.7% from the most speculative level of valuations in U.S. history – exceeding even the 1929 and 2000 extremes, based on the valuation measures we find best-correlated with actual subsequent market returns in cycles across history. The apparent shallowness of this loss isn’t a sign of “resilience.” Despite being nearly a year into what we expect to be a far deeper retreat, the relatively shallow loss isn’t even surprising. The same thing happened in the first year of each of the three deepest post-war stock market collapses: 2000-2002, 2007-2009, and 1973-74...For our part, our most reliable valuation measures imply negative 10-12 year market returns, and a potential market loss on the order of -60% from current levels over the completion of the present market cycle.” Commentary at...
https://www.hussmanfunds.com/comment/mc221219/
My cmt: While a crash from current market levels is possible, it seems unlikely at this point. Here are some other thoughts by Pros...
https://www.youtube.com/watch?v=Cao1nSHWvGo
My cmt: The presentation shows many charts improving thus indicating a higher probability of good things happening in the future. The charts were from Thursday. Friday, there were more bullish indications, most notably, the S&P 500 broke above its 200-day moving average.
“During a typical 4-year presidential term, the stock market tends to be flattish during the first 2 years...But third years are really consistently up, almost all of the time. The notable exceptions were 1931, when the world was in the middle of the Great Depression, and 1939, when the Wehrmacht was marching through Poland. Outside of conditions like those, the third year can usually be counted on to be an up year.” Commentary at...
https://www.mcoscillator.com/learning_center/weekly_chart/3rd_year_of_presidential_term_is_supposed_to_be_bullish/
-Tuesday the S&P 500 dipped about 0.2% to 3991.
-VIX rose about 6% to 19.36.
-The yield on the 10-year Treasury rose to 3.549%.
-Drop from Top: 16.8% as of today. 25.4% max (on a closing basis).
-Trading Days since Top: 260-days.
The S&P 500 is 0.3% ABOVE its 200-dMA & 1.8% ABOVE its 50-dMA.
*I won’t call the correction over until the S&P 500 makes a new-high; however, evidence suggests the bottom was in the 3600 area.
I am doing less trading now. You may do better watching the momentum charts rather than my moves.
XLK – Technology ETF.
SSO – 2x S&P 500. (My indicators are improving.)
XLE – Energy Sector ETF. Low PE; good Dividend; decent momentum.
BA – (Boeing) I am late on this one, but we’ll see.
XLY - Consumer Discretionary ETF.
“Looking good Billy Ray! Feeling good Lewis!”
(The important BUY in this indicator was on 21 October, 7-days after the bottom. The NTSM buy-signal was 27 September, based on improved internals at the retest low, about 2% before the bottom.)
Bottom line: I’m a BULL. I am over-invested in the markets.
I now have about 75% of the portfolio invested in stocks. (As a retiree, 50% invested in stocks is my “normal” portfolio.) As the rally ages, I’ll cut back toward a 50% stock allocation more suitable for my status as a retiree.
BEST ETFs - MOMENTUM ANALYSIS:
TODAY’S RANKING OF 15 ETFs (Ranked Daily)
ETF ranking follows:
*For additional background on the ETF ranking system see NTSM Page at…
http://navigatethestockmarket.blogspot.com/p/exchange-traded-funds-etf-ranking.html
BEST DOW STOCKS - TODAY’S MOMENTUM RANKING OF THE DOW 30 STOCKS (Ranked Daily)
DOW 30 momentum ranking follows:
For more details, see NTSM Page at…
https://navigatethestockmarket.blogspot.com/p/a-system-for-trading-dow-30-stocks-my_8.html
TUESDAY MARKET INTERNALS (NYSE DATA)
My basket of Market Internals remained BUY. (Market Internals are a decent trend-following analysis of current market action, but should not be used alone for short term trading. They are most useful when they diverge from the Index.)