“Trade what you see; not what you think.” – The Old Fool,
Richard McCranie, trader extraordinaire.
JOBLESS CLAIMS (CNBC)
“The number of Americans filing new claims for unemployment benefits unexpectedly fell last week, suggesting the labor market remains tight despite higher interest rates. Initial claims for state unemployment benefits dropped 15,000 to a seasonally adjusted 190,000 for the week ended Jan. 14...” Story at...
https://www.cnbc.com/2023/01/19/us-weekly-jobless-claims-unexpectedly-fall.html
HOUSING STARTS (YahooFinance)
“Housing starts dropped further in December to 1.38 million, down 1.4% from revised November 2022 estimate and down 21.8% from December 2021, according to the U.S. Census Bureau.” Story at...
https://finance.yahoo.com/news/december-housing-starts-homebuilding-activity-141424684.html
PHILADLEPHIA FED INDEX (Investing.com)
“The Philadelphia Federal Reserve's manufacturing index rose modestly for a second straight month, to -8.9 from an upwardly revised level of -13.7 in December. While the index level is still low by historical standards, it contrasts starkly with a plunge in the analogous index published earlier in the week by the New York Fed.” Story at...
https://www.investing.com/news/economic-indicators/philly-fed-manufacturing-index-rose-in-january-but-activity-still-contracted-2983961
EIA CRUDE OIL INVENTORIES (EIA)
“U.S. commercial crude oil inventories (excluding those in the Strategic Petroleum Reserve) increased by 8.4 million barrels from the previous week. At 448.0 million barrels, U.S. crude oil inventories are about 3% above the five year average for this time of year.” Story at...
https://ir.eia.gov/wpsr/wpsrsummary.pdf
MARKET REPORT / ANALYSIS
-Thursday the S&P 500 fell about 0.8% to 3899.
-VIX rose about 0.9% to 20.52.
-The yield on the 10-year Treasury rose to 3.405%.
PULLBACK DATA:
-Drop from Top: 18.7% as of today. 25.4% max (on a closing basis).
-Trading Days since Top: 262-days.
The S&P 500 is 1.8% BELOW its 200-dMA & 0.7% BELOW its 50-dMA.
*I won’t call the correction over until the S&P 500 makes a new-high; however, evidence suggests the bottom was in the 3600 area.
MY TRADING POSITIONS:
I am doing less trading now. You may do better watching the momentum charts rather than my moves.
XLK – Technology ETF.
SSO – 2x S&P 500.
XLE – Energy Sector ETF. Low PE; good Dividend; decent momentum.
BA – (Boeing) I am late on this one, but we’ll see.
XLY - Consumer Discretionary ETF.
SHY – Short term bonds. 30-day yield is 4.2%. (Trailing
1-year yield is 1.3%.) I’ll hold this, but if the market retests the lows, I’ll
sell it and buy stocks.)
TODAY’S COMMENT:
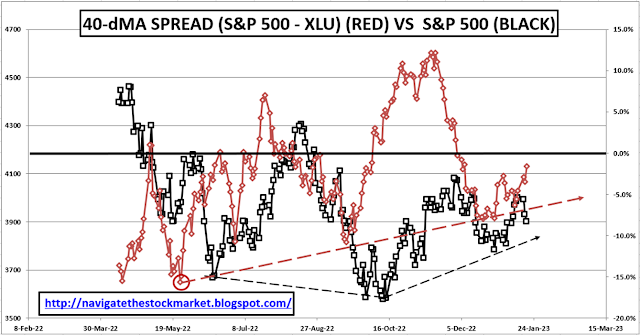
I noted that on Wednesday, spreads were bullish when we compare Utilities, Consumer Staples and Consumer Discretionary sectors of the market to the S&P 500. Today that wasn’t the case, so let’s look at a longer-term indicator for Utilities vs the S&P 500. The chart below is constructed so that if the spread (red line) is below zero, Utilities are outpacing the S&P 500. That’s a bearish indication, but the slope of the curve is up. That suggests improvement in a bullish direction, i.e., the S&P 500 has been advancing faster than Utilities. Overall, that suggests I need to be patient and stay fully invested for a while longer.
The A/D (Advance / Decline) Ratio remained overbought
today, so we may not have seen the end of selling. I still don’t expect too much
downside, but we’ll see. It’s all up to the earnings now as earnings season is
underway.
Today, the daily sum of 20 Indicators fell from +7 to +1
(a positive number is bullish; negatives are bearish); the 10-day smoothed sum
that smooths the daily fluctuations decreased from +117 to 106. (The trend
direction is more important than the actual number for the 10-day value.) These
numbers sometimes change after I post the blog based on data that comes in
late. Most of these 20 indicators are short-term so they tend to bounce around
a lot.
LONG-TERM INDICATOR: The Long Term NTSM indicator declined
to HOLD: PRICE is positive. VOLUME, VIX & SENTIMENT are neutral.
(The important BUY in this indicator was on 21 October, 7-days after the bottom. My NTSM buy-signal was 27 September, based on improved internals at the retest low, about 2% before the bottom.)
Bottom line: I’m a BULL, but I am watching indicators closely. I am over-invested in the markets.
I now have about 75% of the portfolio invested in stocks. (As a retiree, 50% invested in stocks is my “normal” portfolio.) As the rally ages, I’ll cut back toward a 50% stock allocation more suitable for my status as a retiree.
BEST ETFs - MOMENTUM ANALYSIS:
TODAY’S RANKING OF 15 ETFs (Ranked Daily)
ETF ranking follows:

The top ranked ETF receives 100%. The rest are then ranked based on their momentum relative to the leading ETF.
*For additional background on the ETF ranking system see NTSM Page at…
http://navigatethestockmarket.blogspot.com/p/exchange-traded-funds-etf-ranking.html
BEST DOW STOCKS - TODAY’S MOMENTUM
RANKING OF THE DOW 30 STOCKS (Ranked Daily)
DOW 30 momentum ranking follows:

The top ranked Stock receives 100%. The rest are then ranked based on their momentum relative to the leading Stock.
For more details, see NTSM Page at…
https://navigatethestockmarket.blogspot.com/p/a-system-for-trading-dow-30-stocks-my_8.html
THURSDAY MARKET INTERNALS
(NYSE DATA)
 My basket of Market Internals remained HOLD. (Market Internals are a
decent trend-following analysis of current market action, but should not be
used alone for short term trading. They are most useful when they diverge from
the Index.)
My basket of Market Internals remained HOLD. (Market Internals are a
decent trend-following analysis of current market action, but should not be
used alone for short term trading. They are most useful when they diverge from
the Index.)

...My current invested
position is about 75% stocks, including stock mutual funds and ETFs. I’m
usually about 50% invested in stocks.
I trade about 15-20% of the
total portfolio using the momentum-based analysis I provide here. If I can see
a definitive bottom, I’ll add a lot more stocks to the portfolio using an
S&P 500 ETF.
“The number of Americans filing new claims for unemployment benefits unexpectedly fell last week, suggesting the labor market remains tight despite higher interest rates. Initial claims for state unemployment benefits dropped 15,000 to a seasonally adjusted 190,000 for the week ended Jan. 14...” Story at...
https://www.cnbc.com/2023/01/19/us-weekly-jobless-claims-unexpectedly-fall.html
“Housing starts dropped further in December to 1.38 million, down 1.4% from revised November 2022 estimate and down 21.8% from December 2021, according to the U.S. Census Bureau.” Story at...
https://finance.yahoo.com/news/december-housing-starts-homebuilding-activity-141424684.html
“The Philadelphia Federal Reserve's manufacturing index rose modestly for a second straight month, to -8.9 from an upwardly revised level of -13.7 in December. While the index level is still low by historical standards, it contrasts starkly with a plunge in the analogous index published earlier in the week by the New York Fed.” Story at...
https://www.investing.com/news/economic-indicators/philly-fed-manufacturing-index-rose-in-january-but-activity-still-contracted-2983961
“U.S. commercial crude oil inventories (excluding those in the Strategic Petroleum Reserve) increased by 8.4 million barrels from the previous week. At 448.0 million barrels, U.S. crude oil inventories are about 3% above the five year average for this time of year.” Story at...
https://ir.eia.gov/wpsr/wpsrsummary.pdf
-Thursday the S&P 500 fell about 0.8% to 3899.
-VIX rose about 0.9% to 20.52.
-The yield on the 10-year Treasury rose to 3.405%.
-Drop from Top: 18.7% as of today. 25.4% max (on a closing basis).
-Trading Days since Top: 262-days.
The S&P 500 is 1.8% BELOW its 200-dMA & 0.7% BELOW its 50-dMA.
*I won’t call the correction over until the S&P 500 makes a new-high; however, evidence suggests the bottom was in the 3600 area.
I am doing less trading now. You may do better watching the momentum charts rather than my moves.
XLK – Technology ETF.
SSO – 2x S&P 500.
XLE – Energy Sector ETF. Low PE; good Dividend; decent momentum.
BA – (Boeing) I am late on this one, but we’ll see.
XLY - Consumer Discretionary ETF.
I noted that on Wednesday, spreads were bullish when we compare Utilities, Consumer Staples and Consumer Discretionary sectors of the market to the S&P 500. Today that wasn’t the case, so let’s look at a longer-term indicator for Utilities vs the S&P 500. The chart below is constructed so that if the spread (red line) is below zero, Utilities are outpacing the S&P 500. That’s a bearish indication, but the slope of the curve is up. That suggests improvement in a bullish direction, i.e., the S&P 500 has been advancing faster than Utilities. Overall, that suggests I need to be patient and stay fully invested for a while longer.
(The important BUY in this indicator was on 21 October, 7-days after the bottom. My NTSM buy-signal was 27 September, based on improved internals at the retest low, about 2% before the bottom.)
Bottom line: I’m a BULL, but I am watching indicators closely. I am over-invested in the markets.
I now have about 75% of the portfolio invested in stocks. (As a retiree, 50% invested in stocks is my “normal” portfolio.) As the rally ages, I’ll cut back toward a 50% stock allocation more suitable for my status as a retiree.
BEST ETFs - MOMENTUM ANALYSIS:
TODAY’S RANKING OF 15 ETFs (Ranked Daily)
ETF ranking follows:
The top ranked ETF receives 100%. The rest are then ranked based on their momentum relative to the leading ETF.
*For additional background on the ETF ranking system see NTSM Page at…
http://navigatethestockmarket.blogspot.com/p/exchange-traded-funds-etf-ranking.html
DOW 30 momentum ranking follows:
The top ranked Stock receives 100%. The rest are then ranked based on their momentum relative to the leading Stock.
For more details, see NTSM Page at…
https://navigatethestockmarket.blogspot.com/p/a-system-for-trading-dow-30-stocks-my_8.html