“Trade what you see; not what you think.” – The Old Fool, Richard McCranie, trader extraordinaire.
“Consumer sentiment remained low from a historical perspective but continued lifting for the second consecutive month, rising 8% above December and reaching about 4% below a year ago. Current assessments of personal finances surged 16% to its highest reading in eight months on the basis of higher incomes and easing inflation. Although the short-run economic outlook fell modestly from December, the long-run outlook rose 7% to its highest level in nine months and is now 17% below its historical average. Year-ahead inflation expectations receded for the fourth straight month, falling to 4.0% in January from 4.4% in December.” Press release at...
http://www.sca.isr.umich.edu/
“The CPI, which measure of basket of items most frequently purchased by consumers, homes, food, energy, apparel, etc., has not only stopped going up but, as of yesterday’s report, [12 Jan] showed its first monthly decline since inflation broke out... Core consumer prices have also sharply and rapidly descended from their mid-2022 peak...The markets are not the only indicators saying inflation has peaked, the data, themselves, are making the self-same case. Inflation is dead. Long live inflation!” – Ron Insana. Story at...
https://www.cnbc.com/2023/01/13/insana-says-the-case-is-clear-that-inflation-is-over.html?qsearchterm=inflation
-Friday the S&P 500 rose about 0.4% to 3999.
-VIX fell about 3% to 18.35.
-The yield on the 10-year Treasury rose to 3.505%.
-Drop from Top: 16.6% as of today. 25.4% max (on a closing basis).
-Trading Days since Top: 258-days.
The S&P 500 is 0.4% ABOVE its 200-dMA & 2.2% ABOVE its 50-dMA.
*I won’t call the correction over until the S&P 500 makes a new-high; however, evidence suggests the bottom was in the 3600 area.
I am doing less trading now. You may do better watching the momentum charts rather than my moves.
XLK – Technology ETF.
SSO – 2x S&P 500. (My indicators are improving.)
XLE – Energy Sector ETF. Low PE; good Dividend; decent momentum.
BA – I am late on this one, but we’ll see.
XLY - Consumer Discretionary.
Sentiment turned Bullish today because there are too many bears betting against the markets. (I measure Sentiment as %-Bulls (Bulls/{bulls+bears}) based on the amounts invested in selected Rydex/Guggenheim mutual funds.) My buy-sell limits are based on a 5-day moving average and standard deviation analysis. The values might be much more negative at the bottom of a major crash, but for now, I am seeing investors betting the rally will fail at the 200-dMA, thus giving us a bull-signal. Sentiment has been bullish at various times during this bear market, most recently after the October 12 lows, so Sentiment alone cannot be used for market timing.
-There was a Zweig Breadth Thrust 12 January. That’s a rare, very-bullish sign.
-There was a Follow-thru day 6 January and that cancels prior Distribution Days.
-The 10-dMA percentage of issues advancing on the NYSE (Breadth) is above 50%.
-The 50-dMA percentage of issues advancing on the NYSE (Breadth) is above 50%.
-Sentiment.
-The smoothed advancing volume on the NYSE is increasing.
-MACD of the percentage of issues advancing on the NYSE (breadth) made a bullish crossover 13 Jan.
-MACD of S&P 500 price made a bullish crossover 11 Jan.
-My Money Trend indicator is improving.
-Short-term new-high/new-low data.
-Long-term new-high/new-low data.
-McClellan Oscillator.
-VIX indicator. (VIX is falling fast enough to be bullish.)
-XLI-ETF (Cyclical Industrials) is outperforming the S&P 500.
-The 5-day EMA is above the 10-day EMA so short-term momentum is bullish.
-The 5-10-20 Timer System is BUY; the 5-dEMA and 10-dEMA are both above the 20-dEMA.
-Slope of the 40-dMA of New-highs is rising.
-66% of the 15-ETFs that I track have been up over the last 10-days.
-There has only been 1 Statistically-Significant day (big moves in price-volume) in the last 15-days.
-Issues advancing on the NYSE (Breadth) compared to the S&P 500.
-The short-term, 10-day, Fosback Hi-Low Logic Index is neutral although leaning bullish.
-The longer-term, 50-dEMA, Fosback Hi-Low Logic Index is neutral although leaning bullish.
-There have been 5 up-days over the last 10 sessions – neutral.
-There have been 9 up-days over the last 20 sessions - neitral.
-The graph of the 100-day Count (the 100-day sum of up-days) has flattened.
-RSI
-The Smart Money (late-day action) is mixed.
-The 50-dMA percentage of issues advancing on the NYSE (Breadth) has been above 50%, for 3 days in a row ending the “correction-now” signal.
-The Calm-before-the-Storm/Panic Indicator flashed a panic-buying signal 10 November - expired.
-90% down-volume days - the last one was 5 Dec. - neutral. (There has been a 90% up-volume day since then, but it did not meet all of the tests for a bullish 90% up-volume day.)
-The S&P 500 is 0.4% above its 200-dMA. (Bull indicator is 12% below the 200-day, although this is based on “normal” pullbacks.)
-There was a Hindenburg Omen signal 8 April – expired.
-2.8% of all issues traded on the NYSE made new, 52-week highs when the S&P 500 made a new all-time-high, 3 January 2022. (There is no bullish signal for this indicator.) This indicated that the advance was too narrow and a correction was likely to be >10%. It proved correct, but is now Expired
-The 52-week, New-high/new-low ratio improved by 3.5 standard deviations. More simply, the spread between new-highs and new-lows improved by 716 on 14 October. That’s a solid bottom sign at a retest. – Expired.
-13 & 21 Oct were Bullish Outside Reversal Days with no Bearish Outside Reversal days since then - expired.
-On average, the size of up-moves has been larger than the size of down-moves over the last month, but not enough to send a signal.
-The 100-dMA percentage of issues advancing on the NYSE (Breadth) is still below 50%, but not by much.
-Smoothed Buying Pressure minus Selling Pressure is falling, but just barely.
-Overbought/Oversold Index (Advance/Decline Ratio) is overbought.
-S&P 500 is underperforming Utilities (XLU-ETF).
-Bollinger Bands.
Bottom line: “Looking good Billy Ray! Feeling good Lewis!” I’m a BULL. I am over-invested in the markets, back to where I was before the recent weakness got me worried that the S&P 500 might make a lower low, even though my analysis suggested that the bottom was roughly 3600 for the S&P 500.
BEST ETFs - MOMENTUM ANALYSIS:
TODAY’S RANKING OF 15 ETFs (Ranked Daily)
ETF ranking follows:

The top ranked ETF receives 100%. The rest are then ranked based on their momentum relative to the leading ETF.
*For additional background on the ETF ranking system see NTSM Page at…
http://navigatethestockmarket.blogspot.com/p/exchange-traded-funds-etf-ranking.html
DOW 30 momentum ranking follows:
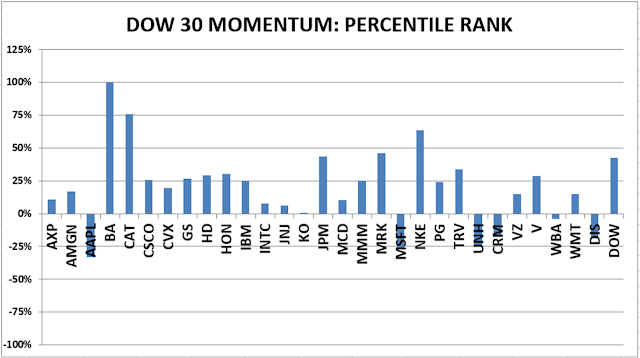
The top ranked Stock receives 100%. The rest are then ranked based on their momentum relative to the leading Stock.
For more details, see NTSM Page at…
https://navigatethestockmarket.blogspot.com/p/a-system-for-trading-dow-30-stocks-my_8.html
