“Trade what you see; not what you think.” – The Old Fool, Richard McCranie, trader extraordinaire.
“Consumers increased their spending in April, by 0.8% from March, double the +0.4% expected and strengthening from the 0.1% increase in March... Real consumer spending, which is adjusted for inflation, increased 0.5% in April, up from 0.0% in March. That "resilient rebound" is "another sign that the economy refuses to go gently into that good night," Joseph Brusuelas, RSM US chief economist, said via tweet.” Story at...
https://seekingalpha.com/news/3975401-personal-spending-jumps-in-april-pce-inflation-ticks-up-from-march
“The increase in the personal consumption expenditures index was a tick higher than the Wall Street forecast. The PCE index is the Federal Reserve's preferred inflation barometer. The yearly increase in prices rose to 4.4% from 4.2% in the prior month...the core PCE index, which omits food and energy, suggests the progress in reducing inflation may have stalled. It also rose 0.4% last month.” Story at...
https://www.morningstar.com/news/marketwatch/20230526358/us-prices-rise-sharply-pce-shows-in-sign-fight-vs-inflation-has-stalled
“Orders for U.S. manufactured goods jumped 1.1% in April largely because of the military, but business investment also rose sharply in a positive sign for the economy.” Story at...
https://www.morningstar.com/news/marketwatch/20230526423/durable-goods-orders-get-a-boost-from-military-spending
“Consumer sentiment slid 7% amid worries about the path of the economy, erasing nearly half of the gains achieved after the all-time historic low from last June. This decline mirrors the 2011 debt ceiling crisis, during which sentiment also plunged. This month, sentiment fell severely for consumers in the West and those with middle incomes. The year-ahead economic outlook plummeted 17% from last month. Long-run expectations plunged by 13% as well, indicating that consumers are concerned that any recession to come may cause lasting pain.” Story at...
http://www.sca.isr.umich.edu/
-Friday the S&P 500 rose about 1.3% to 4205.
-VIX slipped about 6% to 17.95.
-The yield on the 10-year Treasury slipped to 3.806%.
-Drop from Top: 12.3%. 25.4% max (on a closing basis).
-Trading Days since Top: 351-days.
The S&P 500 is 5.8% ABOVE its 200-dMA and 2.6% ABOVE its 50-dMA.
*I won’t call the correction over until the S&P 500 makes a new-high; however, evidence suggests the bottom was in the 3600 area and we called a buy on 4 October 2022.
I am not trading as much as in the past. You may wish to use the momentum charts and/or the Monday 40-day gain charts for trading the Dow stocks and ETFs.

Chart from...
https://www.macrotrends.net/stocks/charts/MSFT/microsoft/pe-ratio
XLE – Energy Sector ETF. XLE tested its March low on 16 May on lower volume so I continue to hold it.
XLY - Consumer Discretionary ETF.
Here’s my weekly review of indicators:
The weekly rundown of indicators slipped more to the bear side, but remained bullish overall (now 7-bear and 13-bull). (These indicators tend to be both long-term and short-term, so they are different than the 20 that I report on daily.)
-The smoothed advancing volume on the NYSE is rising.
-The 50-dMA percentage of issues advancing on the NYSE (Breadth) is above 50%.
-The 100-dMA percentage of issues advancing on the NYSE (Breadth) is above 50%.
-MACD of the percentage of issues advancing on the NYSE (breadth) made a bullish crossover 19 May.
-Smoothed Buying Pressure minus Selling Pressure is rising.
-MACD of S&P 500 price made a bullish crossover 26 May.
-Short-term new-high/new-low data.
-The graph of the 100-day Count (the 100-day sum of up-days) is moving higher.
-On average, the size of up-moves has been larger than the size of down-moves over the last month.
-The 5-10-20 Timer System is BUY.
-The 5-day EMA is above the 10-day EMA so short-term momentum is bullish.
-S&P 500 spread vs. Utilities (XLU-ETF).
-Slope of the 40-dMA of New-highs is rising but not by much.
-There was a Distribution Day 23 May. – Neutral.
-There have been 3 Statistically-Significant days (big moves in price-volume) in the last 15-days.
-Sentiment.
-The 50-dMA percentage of issues advancing on the NYSE (Breadth) has not been below 50%, for more than 3 days in a row.
-Overbought/Oversold Index (Advance/Decline Ratio).
-Bollinger Band Squeeze 28 April - expired.
-The long-term, 50-dEMA, Fosback Hi-Low Logic Index is neutral.
-The short-term, 10-day EMA, Fosback Hi-Low Logic Index is neutral.
-There have been 6 up-days over the last 10 sessions – neutral.
-There have been 9 up-days over the last 20 sessions - neutral.
-RSI
-VIX indicator.
-There was a 90% down-volume day 9 March.
-There was a Hindenburg Omen signal 3 May 2023. The McClellan Oscillator turned positive 18 May. – Expired.
-The S&P 500 is 5.8% above its 200-dMA. (Bear indicator is 12% above the 200-day.)
-There was a Zweig Breadth Thrust 31 March. That’s a rare, very-bullish sign, but the McClellan Oscillator turned negative, so this indicator has expired.
-The Calm-before-the-Storm/Panic Indicator flashed a panic-buying signal 10 November - expired.
-2.8% of all issues traded on the NYSE made new, 52-week highs when the S&P 500 made a new all-time-high, 3 January 2022. (There is no bullish signal for this indicator.) This indicated that the advance was too narrow and a correction was likely to be >10%. It proved correct, but is now Expired.
-10 May there was a Bullish Outside Reversal Day – Expired.
-47% of the 15-ETFs that I track have been up over the last 10-days.
-The 10-dMA percentage of issues advancing on the NYSE (Breadth) is below 50%.
-Issues advancing on the NYSE (Breadth) compared to the S&P 500. The Index is too far ahead of Breadth.
-My Money Trend indicator is falling.
-Long-term new-high/new-low data.
-McClellan Oscillator.
-The Smart Money (late-day action) is pointing down.
-XLI-ETF (Cyclical Industrials) is underperforming the S&P 500.
TODAY’S RANKING OF 15 ETFs (Ranked Daily)
ETF ranking follows:

The top ranked ETF receives 100%. The rest are then ranked based on their momentum relative to the leading ETF.
*For additional background on the ETF ranking system see NTSM Page at…
http://navigatethestockmarket.blogspot.com/p/exchange-traded-funds-etf-ranking.html
DOW 30 momentum ranking follows:
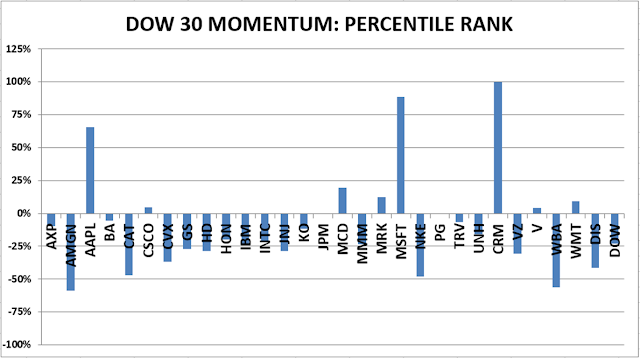
The top ranked Stock receives 100%. The rest are then ranked based on their momentum relative to the leading Stock.
For more details, see NTSM Page at…
https://navigatethestockmarket.blogspot.com/p/a-system-for-trading-dow-30-stocks-my_8.html
