“Trade what you see; not what you think.” – The Old Fool,
Richard McCranie, trader extraordinaire.
“Despite impressive
efforts at spinning the findings by the media, the Durham
Report highlighted two scandals. First, there was a comprehensive effort of the
political and media establishments to perpetrate one of the great hoaxes in
history — a political hit job that ultimately derailed an American presidency.
Second, there was no real accountability for that effort for the main players
from Clinton to Comey to Congress. It was much like The Murder on the Orient
Express. The question is not “whodunit” but who didn’t do it.
Spoiler alert: they all did it so no one was punished.” – Jonathan Turley, Shapiro
Chair for Public Interest Law at The George
Washington University Law School, where he teaches torts, criminal procedure, and constitutional law. Commentary at...
https://jonathanturley.org/
FOMC (FED) MINUTES (Benzinga)
"The minutes of the May 2-3 FOMC meeting revealed uncertainty about how much more policy tightening may be appropriate, with some FOMC participants warning that a failure to raise the federal debt limit in a timely manner will threaten significant financial system disruptions and lead to tighter financial conditions... The economic forecast prepared by the staff for the May FOMC meeting forecasted a mild recession starting later this year, followed by a modestly paced recovery.” Story at...
https://www.benzinga.com/economics/macro-economic-events/23/05/32555812/fed-may-not-be-done-hiking-interest-rates-missing-the-debt-ceiling-deadline-will-
CRUDE INVENTORIES (EIA)
“U.S. commercial crude oil inventories (excluding those in the Strategic Petroleum Reserve) decreased by 12.5 million barrels from the previous week. At 455.2 million barrels, U.S. crude oil inventories are 3% below the five year average for this time of year.” Report at...
https://ir.eia.gov/wpsr/wpsrsummary.pdf
MARKET REPORT / ANALYSIS
-Wednesday the S&P 500 fell about 0.7% to 4115.
-VIX rose about 9% to 20.12.
-The yield on the 10-year Treasury rose to 3.750%.
PULLBACK DATA:
-Drop from Top: 14.2%. 25.4% max (on a closing basis).
-Trading Days since Top: 348-days.
The S&P 500 is 3.5% ABOVE its 200-dMA and 0.6% ABOVE its 50-dMA.
*I won’t call the correction over until the S&P 500 makes a new-high; however, evidence suggests the bottom was in the 3600 area and we called a buy on 4 October 2022.
MY TRADING POSITIONS:
I am not trading as much as in the past. You may wish to use the momentum charts and/or the Monday 40-day gain charts for trading the Dow stocks and ETFs.
MSFT – Microsoft.
XLK – Technology ETF.
XLE – Energy Sector ETF. XLE tested its March low on 16 May on lower volume so I continue to hold it.
XLY - Consumer Discretionary ETF.
KRE – Regional Banking ETF. This is a very small position
for me. KRE tested the May 4 low of 36.08 on much lower volume 11 & 12
May.
SHY – Short term bonds. 30-day yield is 4%. (Trailing
1-year yield is 1.6%.) I’ll hold this, but if the market retests the lows, I’ll
sell it and buy stocks.)
TODAY’S COMMENT:
The S&P 500 is now only 0.6% above its 50-dMA. It looks like the 50-dMA may not hold, just based on my guess.
The next line of support may be the lower trend line. There’s
always some guess work in drawing trend lines – it all depends on the scales
used in the charts. The current Lower, trend line looks like it is around 4000.
That’s about 2.5% below where the S&P 500 closed Wednesday. That’s where this dip may settle if the Index
doesn’t hold the 50-dMA. That is roughly half way between the 100-dMA and the
200-dMA.
200-day moving average of the S&P 50 turned down
today. It had been rising since 30 March 2023.
The daily spread of 20 Indicators (Bulls minus Bears) declined
from -4 to -9 (a positive number is bullish; negatives are bearish); the 10-day
smoothed sum that smooths the daily fluctuations declined from +13 to -2.
(The trend direction is more important than the actual number for the 10-day
value.) These numbers sometimes change after I post the blog based on data that
comes in late. Most of these 20 indicators are short-term so they tend to
bounce around a lot.
LONG-TERM INDICATOR: The Long Term NTSM indicator remained
HOLD: PRICE is positive; SENTIMENT, VIX & VOLUME are neutral.
(The important BUY in this indicator was on 21 October,
7-days after the bottom. For my NTSM overall signal, I suggested that a
short-term buying opportunity occurred on 27 September (based on improved
market internals on the retest), although without market follow-thru, I was
unwilling to call a buy; however, I did close shorts and increased stock
holdings. I issued a Buy-Signal on 4 October, 6-days before the final bottom,
based on stronger market action that confirmed the market internals signal. The
NTSM sell-signal was issued 20 December, 8 sessions before the high of this
recent bear market, based on the bearish “Friday Rundown” of indicators.)
Bottom line: I remain a Bull.
ETF - MOMENTUM ANALYSIS:
TODAY’S RANKING OF 15 ETFs (Ranked Daily)
ETF ranking follows:
https://jonathanturley.org/
"The minutes of the May 2-3 FOMC meeting revealed uncertainty about how much more policy tightening may be appropriate, with some FOMC participants warning that a failure to raise the federal debt limit in a timely manner will threaten significant financial system disruptions and lead to tighter financial conditions... The economic forecast prepared by the staff for the May FOMC meeting forecasted a mild recession starting later this year, followed by a modestly paced recovery.” Story at...
https://www.benzinga.com/economics/macro-economic-events/23/05/32555812/fed-may-not-be-done-hiking-interest-rates-missing-the-debt-ceiling-deadline-will-
“U.S. commercial crude oil inventories (excluding those in the Strategic Petroleum Reserve) decreased by 12.5 million barrels from the previous week. At 455.2 million barrels, U.S. crude oil inventories are 3% below the five year average for this time of year.” Report at...
https://ir.eia.gov/wpsr/wpsrsummary.pdf
-Wednesday the S&P 500 fell about 0.7% to 4115.
-VIX rose about 9% to 20.12.
-The yield on the 10-year Treasury rose to 3.750%.
-Drop from Top: 14.2%. 25.4% max (on a closing basis).
-Trading Days since Top: 348-days.
The S&P 500 is 3.5% ABOVE its 200-dMA and 0.6% ABOVE its 50-dMA.
*I won’t call the correction over until the S&P 500 makes a new-high; however, evidence suggests the bottom was in the 3600 area and we called a buy on 4 October 2022.
I am not trading as much as in the past. You may wish to use the momentum charts and/or the Monday 40-day gain charts for trading the Dow stocks and ETFs.
XLK – Technology ETF.
XLE – Energy Sector ETF. XLE tested its March low on 16 May on lower volume so I continue to hold it.
XLY - Consumer Discretionary ETF.
The S&P 500 is now only 0.6% above its 50-dMA. It looks like the 50-dMA may not hold, just based on my guess.
TODAY’S RANKING OF 15 ETFs (Ranked Daily)
ETF ranking follows:

The top ranked ETF receives 100%. The rest are then ranked based on their momentum relative to the leading ETF.
*For additional background on the ETF ranking system see NTSM Page at…
http://navigatethestockmarket.blogspot.com/p/exchange-traded-funds-etf-ranking.html
DOW 30 momentum ranking follows:
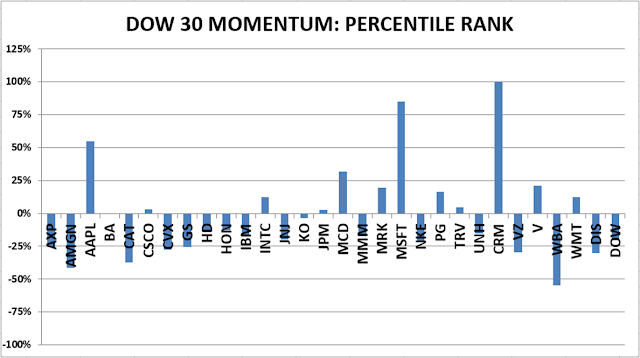
The top ranked Stock receives 100%. The rest are then ranked based on their momentum relative to the leading Stock.
For more details, see NTSM Page at…
https://navigatethestockmarket.blogspot.com/p/a-system-for-trading-dow-30-stocks-my_8.html
