Small Business Optimism ... Momentum Trading DOW Stocks & ETFs … Stock Market Analysis ...
FED PRESIDENT SUGGESTS RATE HIKES ARE AT AN END
(CNBC)
“Philadelphia Federal Reserve President Patrick Harker on
Tuesday indicated that the central bank could be at the end of its current
rate-hiking cycle. A voter this year on the rate-setting Federal Open Market
Committee, the central bank official noted progress in the fight against
inflation and confidence in the economy.”
Story at...
https://www.cnbc.com/2023/08/08/philadelphia-fed-president-patrick-harker-suggests-interest-rate-hikes-are-at-an-end.html
NFIB SMALL BUSINESS OPTIMISM (NFIB)
"The NFIB Small Business Optimism Index increased 0.9 of a
point in July to 91.9, marking the 19th consecutive month below the 49-year
average of 98. Twenty-one percent of owners reported that inflation was their
single most important problem in operating their business, down three points
from June... Of those hiring or trying to hire, 92% of owners reported few or
no qualified applicants for the positions they were trying to fill.” Press
release at...
https://www.nfib.com/surveys/small-business-economic-trends/
MARKET REPORT / ANALYSIS
-Tuesday the S&P 500 dropped about 0.4% to 4499.
-VIX rose about 1% to 15.77.
-The yield on the 10-year Treasury slipped to 4.033
PULLBACK DATA:
-Drop from Top: 6.2%. 25.4% max (on a closing basis).
-Trading Days since Top: 398-days.
The S&P 500 is 9.6% ABOVE its 200-dMA and 1.8%
ABOVE its 50-dMA.
*I won’t call the correction over until the S&P 500
makes a new-high; however, evidence suggests the bottom was in the 3600 area
and we called a buy on 4 October 2022.
MY TRADING POSITIONS:
I am not trading as much as in the past. You may wish to
use the momentum charts and/or the Monday, 40-day gain charts for trading the
Dow stocks and ETFs.
XLK – Technology ETF.
XLY - Consumer Discretionary ETF.
SHY – Short term bonds.
TODAY’S COMMENT:
In the article from CNBC above, Philadelphia Fed
President, Patrick Harker, was quoted as saying, “Absent any alarming new data
between now and mid-September, I believe we may be at the point where we can be
patient and hold rates steady and let the monetary policy actions we have taken
do their work.” While markets didn’t expect a rate hike at the next meeting, there
was a reasonable expectation that another rate hike would be needed later. The
article was published at 8:16 AM EDT, so the news was out before markets opened
this morning. The S&P 500 bottomed around 11 AM. I’d like to say that the Fed
news drove the market higher, but that does not seem to be the case.
Indicators haven't improved much so I expect the pullback
to continue, albeit, not in a straight line. The caveat is that the indicators
aren’t very good at calling short term moves.
The daily spread of 20 Indicators (Bulls minus Bears) improved
from -9 to -8 (a positive number is bullish; negatives are bearish); the 10-day
smoothed sum that smooths the daily fluctuations declined from -45 to -52.
(The trend direction is more important than the actual number for the 10-day
value.) These numbers sometimes change after I post the blog based on data that
comes in late. Most of these 20 indicators are short-term so they tend to
bounce around a lot.
LONG-TERM INDICATOR: The Long Term NTSM indicator
remained HOLD: PRICE is Bullish; VIX, VOLUME & SENTIMENT are neutral.
(The important BUY in this indicator was on 21 October,
7-days after the bottom. For my NTSM overall signal, I suggested that a
short-term buying opportunity occurred on 27 September (based on improved
market internals on the retest), although without market follow-thru, I was
unwilling to call a buy; however, I did close shorts and increased stock
holdings. I issued a Buy-Signal on 4 October, 6-days before the final bottom,
based on stronger market action that confirmed the market internals signal. The
NTSM sell-signal was issued 21 December, 9 sessions before the high of this
recent bear market, based on the bearish “Friday Rundown” of indicators.)
Bottom line: I remain a cautious Bull. The pullback
(underway) is needed to bring the markets back into balance. I’ll go back to an
over-invested position later, probably after the S&P 500 drops below the
50-dMA but before it get’s to the 100-dMA.
ETF - MOMENTUM ANALYSIS:
TODAY’S RANKING OF 15 ETFs
(Ranked Daily)
ETF ranking follows:
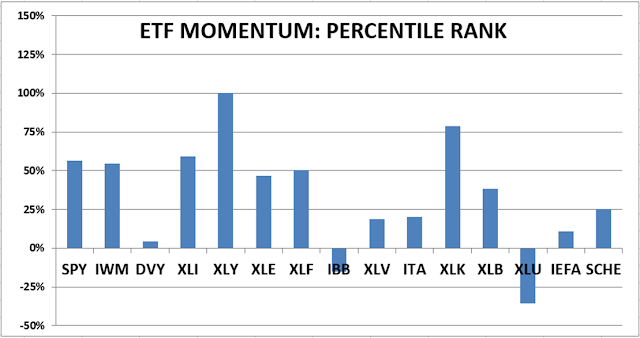
The top ranked ETF receives
100%. The rest are then ranked based on their momentum relative to the leading
ETF.
*For additional background on
the ETF ranking system see NTSM Page at…
http://navigatethestockmarket.blogspot.com/p/exchange-traded-funds-etf-ranking.html
DOW STOCKS - TODAY’S MOMENTUM RANKING
OF THE DOW 30 STOCKS (Ranked Daily)
DOW 30 momentum ranking
follows:
The top ranked Stock receives
100%. The rest are then ranked based on their momentum relative to the leading Stock.
For more details, see NTSM
Page at…
https://navigatethestockmarket.blogspot.com/p/a-system-for-trading-dow-30-stocks-my_8.html
TUESDAY MARKET INTERNALS (NYSE
DATA)
My basket of Market Internals remained SELL. (My basket of Market
Internals is a decent trend-following analysis of current market action, but
should not be used alone for short term trading. They are most useful when they
diverge from the Index.)
...My current invested
position is about 50% stocks, including stock mutual funds and ETFs. I’m
usually about 50% invested in stocks.
I trade about 15-20% of the
total portfolio using the momentum-based analysis I provide here. If I can see
a definitive bottom, I’ll add a lot more stocks to the portfolio using an
S&P 500 ETF as I did back in October.

