“Trade what you see; not what you think.” – The Old Fool, Richard McCranie, trader extraordinaire.
“Consumer Reports' latest car reliability survey suggests electric vehicles (EVs) are causing owners more problems than their hybrid or conventional counterparts.…
According to the survey, based on owner responses on more than 330,000 vehicles, EVs from the past three model years suffered a whopping 79 percent more problems than conventional cars.” Story at...
Electric vehicles earn shocking report card for reliability (msn.com)
“The question of a “soft landing” or an outright “recession” is difficult to answer. It is certainly possible that all of the tell-tale signs of economic recession may be wrong this time. There is another possibility. Given the massive increase in activity due to a shuttered economy and massive fiscal stimulus, the reversion may take longer than expected. Both scenarios support the rising optimism of Wall Street economists in the near term. However, such also brings to mind Bob Farrell’s Rule #9: ‘When all experts agree, something else tends to happen.’... As we update our recessionary indicators, there is still no clear visibility regarding the certainty of a recession. Yes, this ‘time could be different.’ The problem is that, historically, such has not been the case.” - Lance Roberts, Chief Portfolio Strategist/Economist for RIA Advisors, host of “The Lance Roberts Podcast” and Chief Editor of the “Real Investment Advice” website. Commentary at...
https://realinvestmentadvice.com/recessionary-indicators-update-soft-landing-or-worse/

From Chris Ciavacco, Ciovacco Capital. Commentary/Presentation at...
https://www.youtube.com/watch?v=1eb5cAJwwyo
FACTORY ORDERS (YahooNews)
“New orders for U.S.-made goods fell more than expected in October, marking the biggest monthly drop in roughly three and a half years, constrained by weakening demand for durable goods and transportation equipment and bolstering the view that high interest rates are beginning to bite into spending. Factory orders fell 3.6% after a downwardly revised 2.3% in September...” Story at
https://finance.yahoo.com/news/us-factory-orders-fall-3-162241504.html
MARKET REPORT / ANALYSIS
-Monday the S&P 500 slipped about 0.5% to 4570.
-VIX rose about 4% to 13.08.
-The yield on the 10-year Treasury rose to 4.259%.
PULLBACK DATA:
-Drop from Top: 4.2%. 25.4% max (on a closing basis).
-Trading Days since All-Time Top: 482-days. (The top was 3 January 2022.)
The S&P 500 is 6.6% ABOVE its 200-dMA and 4.7% ABOVE its 50-dMA.
*I won’t call the correction over until the S&P 500 makes a new-high; however, evidence suggests the major bear-market bottom (25% decline) was in the 3600 area and we called a buy on 4 October 2022.
MY TRADING POSITIONS:
XLK – Technology ETF (holding since the October 2022 lows).
XLY - Consumer Discretionary ETF. (Holding since the October 2022 lows - I bought more XLY Monday, 8/21.)
I took profits and then reestablished positions as follows:
SPY – I bought a large position in the S&P 500 Friday, 8/14, in my 401k (it has limited choices).
XLE – Added Tuesday, 8/22.
SSO – 2x S&P 500 ETF. Added 8/24.
MSFT – added 11/16/2023.
TODAY’S COMMENT:
After Thursday and Friday were statistically significant up-days, today, Monday we have a statistically significant down-day. That just means that the price-volume move exceeded my statistical parameters. Statistics show that a statistically-significant, down-day is followed by an up-day about 60% of the time. It is concerning to see these relatively large, back-and-forth moves. If it continues it is a warning of a top. RSI remains overbought, but other indicators are not suggesting a top so I’ll not worry about this now.
The S&P 500 has been drifting sideways toward its up-sloping, lower trend-line. I expect the rally will resume later this week or next.
The daily spread of 20 Indicators (Bulls minus Bears) declined from +5 to +3 (a positive number is bullish; negatives are bearish); the 10-day smoothed sum that smooths the daily fluctuations declined from +34 to +39. (The trend direction is more important than the actual number for the 10-day value.) These numbers sometimes change after I post the blog based on data that comes in late. Most of these 20 indicators are short-term so they tend to bounce around a lot.
LONG-TERM INDICATOR: The Long Term NTSM indicator remained BUY: PRICE & VIX are bullish; VOLUME & SENTIMENT are neutral.
(The important major BUY in this indicator was on 21 October 2022, 7-days after the bear-market bottom. For my NTSM overall signal, I suggested that a short-term buying opportunity occurred on 27 September (based on improved market internals on the retest), although without market follow-thru, I was unwilling to call a buy; however, I did close shorts and increased stock holdings. I issued a Buy-Signal on 4 October, 6-days before the final bottom, based on stronger market action that confirmed the market internals signal. The NTSM sell-signal was issued 21 December, 9 sessions before the high of this recent bear market, based on the bearish “Friday Rundown” of indicators.)
BOTTOM LINE
I remain bullish.
ETF - MOMENTUM ANALYSIS:
TODAY’S RANKING OF 15 ETFs (Ranked Daily)
ETF ranking follows:
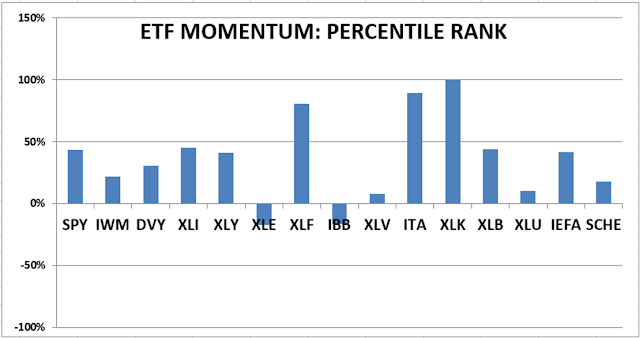
*For additional background on the ETF ranking system see NTSM Page at…
http://navigatethestockmarket.blogspot.com/p/exchange-traded-funds-etf-ranking.html
DOW STOCKS - TODAY’S MOMENTUM RANKING OF THE DOW 30 STOCKS (Ranked Daily)
DOW 30 momentum ranking follows:

For more details, see NTSM Page at…
https://navigatethestockmarket.blogspot.com/p/a-system-for-trading-dow-30-stocks-my_8.html
MONDAY MARKET INTERNALS (NYSE DATA)

I trade about 15-20% of the total portfolio using the momentum-based analysis I provide here. When I see a definitive bottom, I add a lot more stocks to the portfolio using an S&P 500 ETF as I did back in October.