Markets are closed Monday for the George Washington’s birthday. Washington was revered during his time and was unanimously elected President by the Electoral College. Washington stepped down after two-terms and that act established a tradition of Presidents serving only two terms. That tradition was unbroken until Franklin Roosevelt served 13 years, from 1932 until his death in 1945. In 1951, the Constitution was Amended to limit Presidents to two terms.
My cmt: Police have stated that the shootings resulted from a “dispute between people.” Some of the victims (described as “children” by the press) must have been members of a rival gang, at least that’s my speculation. We’ll see.
“Wholesale prices rose more than expected in January, further complicating the inflation picture... The producer price index, a measure of prices received by producers of domestic goods and services, rose 0.3% for the month, the biggest move since August... Excluding food and energy, core PPI increased 0.5%...” Story at...
https://www.cnbc.com/2024/02/16/january-wholesale-prices-rise-0point3percent-more-than-expected.html
My cmt: Both PPI and Core PPI were higher than expected. The market reaction was much less than when the CPI report came out. Since CPI was high, it wasn’t a complete shock that PPI was also above the expected number.

Chart from...
https://www.advisorperspectives.com/dshort/updates/2024/02/16/inflation-ppi-producer-price-index-down-january-2024
“U.S. single-family homebuilding fell in January, likely because of harsh weather conditions, but a rise in permits for future construction suggested a rebound in the coming months. Single-family housing starts, which account for the bulk of homebuilding, dropped 4.7%” ... Story at...
https://www.businessreport.com/newsletters/roundup-us-housing-starts-wholesale-prices-growing-wealth
“Sentiment among U.S. consumers ticked up slightly in February, cementing a recent upswing in confidence as inflation continues to ease. The preliminary reading Friday of the University of Michigan's consumer-confidence index climbed for the third consecutive month to 79.6 points in February from 79.0 in January.” Story at...
https://www.morningstar.com/news/dow-jones/202402164470/us-consumer-confidence-rises-for-third-straight-month-confirming-recovery-university-of-michigan
-Friday the S&P 500 declined about 0.5% to 5006.
-VIX rose about 2% to 14.24.
-The yield on the 10-year Treasury rose to 4.281%.
UWM – Added 1/22/2024.
XLK – Technology ETF (holding since the October 2022 lows).
INTC – Added 12/6/2023.
CRM – Added 1/22/2024
BA – Added 12/6/2023. I plan to hold Boeing for the time being.
DWCPF - Dow Jones U.S. Completion Total Stock Market Index. – Added 12/7/2023 when I sold the S&P 500. This is a large position in my retirement account betting on Small Caps.
We look at a Summary of indicators on Friday (about 50-indicators). These indicators tend to be both long-term and short-term. The weekly rundown of indicators remained Bullish this week, but there were fewer Bull-signs: now 6-bear and 13-bull.
-The smoothed advancing volume on the NYSE is rising.
-The 10-dMA percentage of issues advancing on the NYSE (Breadth) is above 50%.
-The 50-dMA percentage of issues advancing on the NYSE (Breadth) is above 50%.
-The 100-dMA percentage of issues advancing on the NYSE (Breadth) is above 50%
-My Money Trend indicator.
-McClellan Oscillator.
-Short-term new-high/new-low data.
-The graph of the 100-day Count (the 100-day sum of up-days).
-There were back-to-back 80% up-volume days on 14 &15 February canceling the High down-volume, down day on 13 February, although not all of the criteria were met for the high, down-volume day.
-XLI-ETF (Cyclical Industrials) vs the S&P 500.
-The 5-10-20 Timer System is BUY.
-The short-term momentum is bullish.
-63% of the 15-ETFs that I track have been up over the last 10-days. (45-55% is neutral.)
-There have been 3 Distribution Days since 19 Jan Follow-thru day, but not enough to send a signal.
-There have been 3 Statistically-Significant days (big moves in price-volume) in the last 15-days.
-The S&P 500 is 11.6% above its 200-dMA. (The Bear indicator is 12% above the 200-day.)
-Sentiment. (Sentiment got very bearish recently due to the continued march higher. Too much bearishness is bullish, but it is back to neutral now.)
-Bollinger Bands.
-The Bollinger Squeeze has cleared.
-Overbought/Oversold Index (Advance/Decline Ratio).
-The 50-dMA percentage of issues advancing on the NYSE (Breadth) has not been below 50% for more than 3 days in a row.
-Issues advancing on the NYSE (Breadth) compared to the S&P 500.
-On average, the size of up-moves has been smaller than the size of down-moves over the last month, but not enough to send a message.
-7.6% of all issues traded on the NYSE made new, 52-week highs when the S&P 500 made a new all-time-high, 15 February 2024. (There is no bullish signal for this indicator.)
-The short-term, 10-day EMA, Fosback Hi-Low Logic Index.
-The long-term, 50-dEMA, Fosback Hi-Low Logic Index.
-There was a New-high/New-low spread reversal on 4 October (based on std deviation of spread). Expired
-There have been 13 up-days over the last 20 sessions.
-There have been 6 up-days over the last 10 sessions.
-RSI.
-The Calm-before-the-Storm/Panic Indicator flashed a top warning signal 15 Sept., but it may well have been a bottom signal. - Expired
-VIX indicator.
-There was a Hindenburg Omen signal 6 Feb 2024 – expired. The McClellan Oscillator turned positive 9 February.
-20 December there was a Bearish Outside Reversal Day, but the S&P 500 closed above the high for 20 December, 4778, on 27 & 28 December so this one is now neutral.
-There was a Zweig Breadth Thrust 3 November. That’s a rare, very-bullish sign, but the McClellan Oscillator subsequently turned negative ending this signal.
-Long-term new-high/new-low data.
-MACD of the percentage of issues advancing on the NYSE (breadth) made a bearish crossover 12 January.
-MACD of S&P 500 price made a bearish crossover 16 Feb.
-Slope of the 40-dMA of New-highs is falling.
-Smoothed Buying Pressure minus Selling Pressure.
-The Smart Money (late-day action).
-S&P 500 spread vs. Utilities (XLU-ETF).
I remain bullish.
TODAY’S RANKING OF 15 ETFs (Ranked Daily)
ETF ranking follows:

The top ranked ETF receives 100%. The rest are then ranked based on their momentum relative to the leading ETF.
*For additional background on the ETF ranking system see NTSM Page at…
http://navigatethestockmarket.blogspot.com/p/exchange-traded-funds-etf-ranking.html
DOW 30 momentum ranking follows:
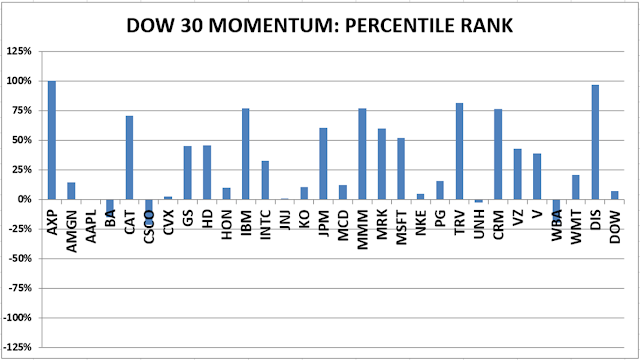
For more details, see NTSM Page at…
https://navigatethestockmarket.blogspot.com/p/a-system-for-trading-dow-30-stocks-my_8.html
