Jobless Claims ... PCE Prices ... Personal Spending ... Momentum Trading DOW Stocks & ETFs … Stock Market Analysis ...
“Trade what you see; not what you think.” – The Old Fool,
Richard McCranie, trader extraordinaire.
“Far
more money has been lost by investors in preparing for corrections, or
anticipating corrections, than has been lost in the corrections themselves.” -
Peter Lynch, former manager of Fidelity’s Magellan® fund.
“It was Thomas Edison who brought us electricity, not the
Sierra Club. It was the Wright brothers who got us off the ground, not the
Federal Aviation Administration. It was Henry Ford who ended the isolation of
millions of Americans by making the automobile affordable, not Ralph Nader.
Those who have helped the poor the most have not been those who have gone
around loudly expressing 'compassion' for the poor, but those who found ways to
make industry more productive and distribution more efficient, so that the poor
of today can afford things that the affluent of yesterday could only dream about.”
― Thomas Sowell
JOBLESS CLAIMS (Fox Business)
“The number of Americans filing for unemployment
benefits rose more than expected last week as high-profile companies
continue to announce major job cuts. Figures
released Thursday by
the Labor Department show initial claims for the week ending Feb. 24 jumped by
13,000 to 215,000...” Story at...
https://www.foxbusiness.com/economy/jobless-claims-jumped-more-expected-last-week
PCE PRICES / PERSONAL INCOME / PERSONAL SPENDING (CNBC)
“Inflation rose in line with expectations in January,
according to an important gauge the Federal Reserve uses as it deliberates
cutting interest rates. The personal consumption expenditures price index
excluding food and energy costs increased 0.4% for the month and 2.8% from a
year ago... The moves came amid an unexpected jump in personal income, which
rose 1%, well above the forecast for 0.3%. Spending decreased 0.1% versus the
estimate for a 0.2% gain.” Story at...
https://www.cnbc.com/2024/02/29/pce-inflation-january-2023-.html
CHICAGO PMI (Advisor Perspectives)
“The latest Chicago Purchasing Manager's Index (Chicago Business
Barometer) fell to 44.0 in February from 46.0 in January, marking the third
straight monthly decline.. The latest reading is worse than the 48.1 forecast
and keeps the index in contraction territory for a third consecutive month.”
Commentary and charts at...
https://www.advisorperspectives.com/dshort/updates/2024/02/29/chicago-pmi-falls-for-3rd-straight-month-in-february
MARKET REPORT / ANALYSIS
-Thursday the S&P 500 rose about 0.5% to 5096.
-VIX dipped about 3% to 13.40.
-The yield on the 10-year Treasury slipped to 4.262%.
MY TRADING POSITIONS:
QLD- Added 2/20/2024
UWM – Added 1/22/2024.
XLK – Technology ETF (holding since the October 2022
lows).
INTC – Added 12/6/2023.
CRM – Added 1/22/2024
Salesforce reported and beat on earnings and revenue, but
their guidance for 2024 was light so CRM dipped about 2% in afterhours trading
on Wednesday. Apparently yhe news wasn’t as bad as it first seemed – CRM was up
3% on Thursday.
BA – Added 12/6/2023. I plan to hold Boeing for the time
being, although my patience is running out! Technically, there is a lot of
support around the 200 level. It closed
at 201.5 on 2/22/2024. If Boeing drops below 200 it will be time to bail out.
DWCPF - Dow Jones U.S. Completion Total Stock Market
Index. – Added 12/7/2023 when I sold the S&P 500. This is a large position
in my retirement account betting on Small Caps.
TODAY’S COMMENT:
It is not unusual in my summary of 50 indicators to have
Bear-indicators even in strong bull-markets. Now, the most concerning of the
Bear-indicators are those that show the markets are stretched. For example, I
mentioned that the S&P 500 was 12.2% above its 200-dMA in yesterday’s blog
post. Today let’s review another worrisome indicator.
I track 15 ETFs in my momentum analysis that I chart
daily and they form an interesting indicator. Those 15 ETFs were chosen as a
cross-section of the markets. I don’t think the exact 15 are particularly
important, as long as one uses a representative sample of the market. Currently,
the 15 ETFs in my momentum analysis are all above their respective 120-dMAs.
That’s a bearish sign, and for evidence, we look at a chart of recent history.
Before we panic though, let’s look at another chart with
the same data, but going back to 2017-2018. It shows that when the % of ETFs
above their 120-dMA hit 100%, there was a significant lag time before a
correction occurred. In 2018, it took 4 months before there was a significant
decline – in that case about 10%.
What does this mean.
We need to be on our toes and accept that a 10% decline (or more) is
possible at any time. Hopefully, we’ll get some warning in the indicators
before we get a decline of that magnitude.
In the meantime, I’ll keep a close eye on indicators and market
action. Today, the news was good - The Summary of About 50-Indicators moved well
to the bullish side and breadth looks good.
8.4% of all issues traded on the NYSE made new, 52-week
highs when the S&P 500 made a new all-time-high, today, 29 February 2024. This
confirms, once again, that the rally is healthy with decent participation in
the advance.
CURRENT SUMMARY OF APPROXIMATELY 50 INDICATORS:
Now there are 3 bear-signs and 18-Bull. Wednesday
there were 6 bear-signs and 15-Bull signs.
LONG-TERM INDICATOR: The Long Term NTSM indicator
remained HOLD: PRICE was positive; VOLUME, SENTIMENT & VIX are neutral.
(The Long-Term Indicator is not a good top-indicator. It
can signal BUY at a top.)
(The important major BUY in this indicator was on 21
October 2022, 7-days after the bear-market bottom. For my NTSM overall signal,
I suggested that a short-term buying opportunity occurred on 27 September
(based on improved market internals on the retest), although without market
follow-thru, I was unwilling to call a buy; however, I did close shorts and
increased stock holdings. I issued a Buy-Signal on 4 October, 6-days before the
final bottom, based on stronger market action that confirmed the market internals
signal. The NTSM sell-signal was issued 21 December, 9 sessions before the high
of this recent bear market, based on the bearish “Friday Rundown” of
indicators.)
BOTTOM LINE
I remain cautiously bullish.
ETF - MOMENTUM ANALYSIS:
TODAY’S RANKING OF 15 ETFs (Ranked Daily) ETF ranking
follows:
The top ranked ETF receives
100%. The rest are then ranked based on their momentum relative to the leading
ETF.
*For additional background on
the ETF ranking system see NTSM Page at…
http://navigatethestockmarket.blogspot.com/p/exchange-traded-funds-etf-ranking.html
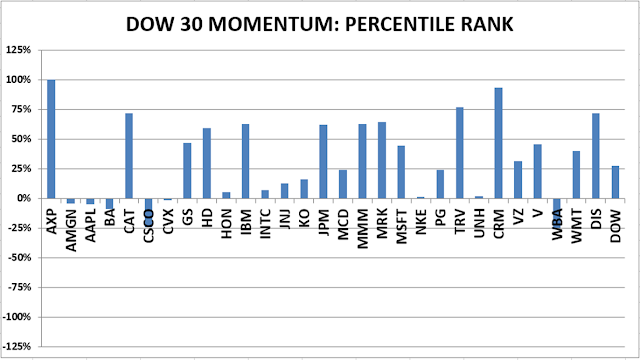
DOW STOCKS - TODAY’S MOMENTUM RANKING
OF THE DOW 30 STOCKS (Ranked Daily)
DOW 30 momentum ranking
follows:
The DOW added Amazon to the Dow 30. I’ll add it, but it’s a time consuming
effort and may take awhile. Walmart split 3 for 1 today and that took some
manipulation in the momentum ranking, too.
The top ranked Stock receives
100%. The rest are then ranked based on their momentum relative to the leading Stock.
For more details, see NTSM
Page at…
https://navigatethestockmarket.blogspot.com/p/a-system-for-trading-dow-30-stocks-my_8.html
THURSDAY MARKET INTERNALS
(NYSE DATA)
My basket of Market Internals remained BUY. (My basket of Market Internals
is a decent trend-following analysis of current market action, but should not
be used alone for short term trading. They are most useful when they diverge
from the Index.)
...My current invested
position is about 70% stocks, including stock mutual funds and ETFs. I’m
usually about 50% invested in stocks. I’m “over invested” now expecting
continuation of bullish market action.
I trade about 15-20% of the total portfolio using the
momentum-based analysis I provide here. When I see a definitive bottom, I add a
lot more stocks to the portfolio using an S&P 500 ETF as I did back in
October.