Crude Inventories ... Momentum Trading DOW Stocks & ETFs … Stock Market Analysis
“Trade what you see; not what you think.” – The Old Fool,
Richard McCranie, trader extraordinaire.
“The survey, released Wednesday by Monmouth University, found that
18% of Americans “think that a covert government effort for Taylor Swift to
help Joe Biden win the presidential election actually exists.” – USA Today.
Story at...
Nearly
1 in 5 Americans believe Taylor Swift is part of a 2024 plot to help Joe Biden
(msn.com)
My cmt: Proving once again that 1 in 5 Americans are
complete idiots.
CRUDE INVENTORIES (EIA)
“U.S. commercial crude oil inventories (excluding those
in the Strategic Petroleum Reserve) increased by 12.0 million barrels from the
previous week. At 439.5 million barrels, U.S. crude oil inventories are about
2% below the five-year average for this time of year.” Report at...
https://ir.eia.gov/wpsr/wpsrsummary.pdf
MARKET REPORT / ANALYSIS
-Wednesday the S&P 500 rose about 1% to 5001.
-VIX fell about 9% to 14.38.
-The yield on the 10-year Treasury rose to 4.234%.
MY TRADING POSITIONS:
UWM – Added 1/22/2024.
XLK – Technology ETF (holding since the October 2022
lows).
INTC – Added 12/6/2023.
CRM – Added 1/22/2024
BA – Added 12/6/2023. I plan to hold Boeing for the time
being.
DWCPF - Dow Jones U.S. Completion Total Stock Market
Index. – Added 12/7/2023 when I sold the S&P 500. This is a large position
in my retirement account betting on Small Caps.
TODAY’S COMMENT:
We got the bounce we were
looking for today. Now let’s see if the
rally can continue. I think that it
will. The Friday Summary of indicators (about 50-indicators) improved to
bullish with 12 Bull and 8 Bear indicators.
The daily chart looked bullish
with a strong finish into the close so we may expect some follow-thru on
Thursday.
The daily spread of 20 short-term Indicators (Bulls minus
Bears) improved from -8 to -3 (a positive number is bullish; negatives
are bearish); the 10-day smoothed sum that smooths the daily fluctuations declined
from +2 to -4. (The trend direction is more important than the actual number
for the 10-day value.) These numbers sometimes change after I post the blog
based on data that comes in late. Most of these 20 indicators are short-term so
they tend to bounce around a lot.
LONG-TERM INDICATOR: The Long Term NTSM indicator improved
to BUY: VOLUME & PRICE are bullish; SENTIMENT & VIX are neutral.
(One warning: The Long-Term Indicator is not a good
top-indicator. It can signal BUY at a top.)
(The important major BUY in this indicator was on 21
October 2022, 7-days after the bear-market bottom. For my NTSM overall signal,
I suggested that a short-term buying opportunity occurred on 27 September
(based on improved market internals on the retest), although without market
follow-thru, I was unwilling to call a buy; however, I did close shorts and
increased stock holdings. I issued a Buy-Signal on 4 October, 6-days before the
final bottom, based on stronger market action that confirmed the market internals
signal. The NTSM sell-signal was issued 21 December, 9 sessions before the high
of this recent bear market, based on the bearish “Friday Rundown” of
indicators.)
BOTTOM LINE
I remain bullish.
ETF - MOMENTUM ANALYSIS:
TODAY’S RANKING OF 15 ETFs (Ranked Daily)
ETF ranking follows:
The top ranked ETF receives
100%. The rest are then ranked based on their momentum relative to the leading
ETF.
*For additional background on
the ETF ranking system see NTSM Page at…
http://navigatethestockmarket.blogspot.com/p/exchange-traded-funds-etf-ranking.html
DOW STOCKS - TODAY’S MOMENTUM RANKING
OF THE DOW 30 STOCKS (Ranked Daily)
DOW 30 momentum ranking
follows:
The top ranked Stock receives
100%. The rest are then ranked based on their momentum relative to the leading Stock.
For more details, see NTSM
Page at…
https://navigatethestockmarket.blogspot.com/p/a-system-for-trading-dow-30-stocks-my_8.html
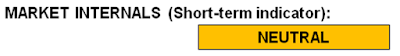
WEDNESDAY MARKET INTERNALS
(NYSE DATA)
My basket of Market Internals improved to HOLD. (My basket of Market
Internals is a decent trend-following analysis of current market action, but
should not be used alone for short term trading. They are most useful when they
diverge from the Index.)
...My current invested
position is about 65% stocks, including stock mutual funds and ETFs. I’m
usually about 50% invested in stocks. I’m “over invested” now expecting
continuation of bullish market action.
I trade about 15-20% of the total portfolio using the
momentum-based analysis I provide here. When I see a definitive bottom, I add a
lot more stocks to the portfolio using an S&P 500 ETF as I did back in
October.