Friday, June 28, 2024

PCE ... CHICAGO PMI ... Momentum Trading DOW Stocks & ETFs … Stock Market Analysis ...

 
“Trade what you see; not what you think.” – The Old Fool, Richard McCranie, trader extraordinaire.
 
“Far more money has been lost by investors in preparing for corrections, or anticipating corrections, than has been lost in the corrections themselves.” - Peter Lynch, former manager of Fidelity’s Magellan® fund.
 
THEY’RE BOTH TOTALLY UNFIT (The Atlantic via msn.com)
“The first presidential debate of this election cycle is over, and what a depressing spectacle it was. I can’t remember feeling guilty watching a campaign event before, but seeing the exchanges between Joe Biden and Donald Trump felt like participating in elder abuse. There’s nothing winsome about pestering old men with incessant questions as if to deny them the dignity of their dotage. Biden was particularly ill-served by the proceedings. From the moment he shuffled onstage and muttered his first answer in a hushed and wheezing monotone, it was clear that he is too old for the job he has right now, and certainly too old for another four-year term. The president is in the wintertime of his life. He ought to rest.” Story at...
They’re Both Totally Unfit (msn.com)
 
PCE (CNN)
“The Personal Consumption Expenditures price index — a closely watched inflation gauge that the Federal Reserve uses for its 2% target — was unchanged from April and slowed to 2.6% for the 12 months ended in May from 2.7% the month before, according to Commerce Department data released Friday. It’s the first time since November that prices didn’t increase on a monthly basis.” Story at...
https://www.cnn.com/2024/06/28/economy/us-pce-inflation-fed-consumer-spending-may/index.html
My cmt: Futures were well up before the open, but declined after the PCE report came out at 8:30. After an early peak, the S&P 500 fell for most of the day.
 
CHICAGO PMI (Advisor Perspectives)
“The latest Chicago Purchasing Manager's Index (Chicago Business Barometer) jumped to 47.4 in June from 35.4 in May. This is the first monthly increase since November of last year and largest monthly increase since July 2020. The latest reading is better than the 39.7 forecast but keeps the index in contraction territory for a seventh consecutive month.” Story at...
https://www.advisorperspectives.com/dshort/updates/2024/06/28/chicago-pmi-jumps-to-7-month-high
 
MARKET REPORT / ANALYSIS
-Friday the S&P 500 declined about 0.4% to 5460.
-VIX rose about 2% to 12.44.
-The yield on the 10-year Treasury rose to 4.392% (compared to this time yesterday).
 
MY TRADING POSITIONS:
XLK – Holding since the October 2022 lows.
 
DWCPF - Dow Jones U.S. Completion Total Stock Market Index. – Added 12/7/2023 when I sold the S&P 500.
“The Dow Jones U.S. Completion Total Stock Market Index, also known as the DWCPF, is a widely used financial index that provides a comprehensive measure of the US equity market. The DWCPF includes all US stocks that are not included in the Dow Jones US Total Stock Market Index, which comprises large-cap and mid-cap companies. As a result, the DWCPF provides a complete picture of the US stock market, including small-cap and micro-cap companies, which are often overlooked by other indexes.” From...
https://fi.money/blog/posts/what-is-dow-jones-u-s-completion-total-stock-market-index-dwcpf
 
CURRENT SUMMARY OF APPROXIMATELY 50 INDICATORS:
The Bull/Bear Spread (Bull Indicators minus Bear Indicators) was 7 Bear-signs and 16-Bull. (The rest are neutral. It is normal to have a lot of neutral indicators since many of those are top or bottom indicators that will signal only at extremes.) The 10-dMA of spread (purple line in the chart below turned up, a bullish sign, although it has bounced back and forth so much that it is hard to tell.
 
We’re still waiting to see if the Index can break above the red trend line in the chart below.

TODAY’S COMMENT:
 
The S&P 500 chart was not encouraging today. Let’s hope that it does not carry over to next week. Friday was a Quarterly Options expiration day, so volumes were about double the norm.
 
While the Bull/Bear, 50-Indicator spread improved from +2 to +9 (9 more Bull indicators than Bear indicators), there were still significant bear signs today.
 
-Friday there was another Bearish outside reversal day. There was one just 4 sessions ago and today’s is the fourth one in 3-weeks.
According to Investopedia: “This demonstrates that the bulls had control over the market before the bears took the reins in a meaningful way, signaling a shift in the overall trend... For instance, a stock may have a small move higher on the first day, climb even higher the second day, but then sharply decline by the second day’s end... This formation is considered a strong indicator that the prior upward momentum is waning and a reversal is on the horizon.”
https://www.investopedia.com/terms/o/outsidereversal.asp#:~:text=A%20bearish%20outside%20reversal%2C%20also,by%20the%20second%20day's%20end
-There was a bearish crossover in the MACD (Moving Average Convergence Divergence) indicator.
-The S&P 500 is 12.2% above the 200-dMA and that remains stretched. The bear sign is greater than 12%.
-Breadth vs. the S&P 500 remains bearish.  
 
On a more positive note:
-Friday was a statistically significant down-day. That just means that the price-volume move exceeded my statistical parameters. Statistics show that a statistically-significant, down-day is followed by an up-day about 60% of the time.
-Breadth improved.
-New-Hi/New-Low data improved on a short-term and long-term basis. (Nearly 5% of issues on the NYSE made new-highs today. That’s impressive on a down day.
 
LONG-TERM INDICATOR: The Long Term NTSM indicator remained HOLD: PRICE is bullish; VOLUME, VIX & SENTIMENT is neutral.
(The Long-Term Indicator is not a good top-indicator. It can signal BUY at a top.)
 
(The important major BUY in this indicator was on 21 October 2022, 7-days after the bear-market bottom. For my NTSM overall signal, I suggested that a short-term buying opportunity occurred on 27 September (based on improved market internals on the retest), although without market follow-thru, I was unwilling to call a buy; however, I did close shorts and increased stock holdings. I issued a Buy-Signal on 4 October, 6-days before the final bottom, based on stronger market action that confirmed the market internals signal. The NTSM sell-signal was issued 21 December, 9 sessions before the high of this recent bear market, based on the bearish “Friday Rundown” of indicators.)
 
BOTTOM LINE
No change: I am Neutral on the market. Perhaps next week we’ll see some signs that will allow me to get more bullish.
 
ETF - MOMENTUM ANALYSIS:
TODAY’S RANKING OF 15 ETFs (Ranked Daily) ETF ranking follows:
 

The top ranked ETF receives 100%. The rest are then ranked based on their momentum relative to the leading ETF.
*For additional background on the ETF ranking system see NTSM Page at…
http://navigatethestockmarket.blogspot.com/p/exchange-traded-funds-etf-ranking.html
 
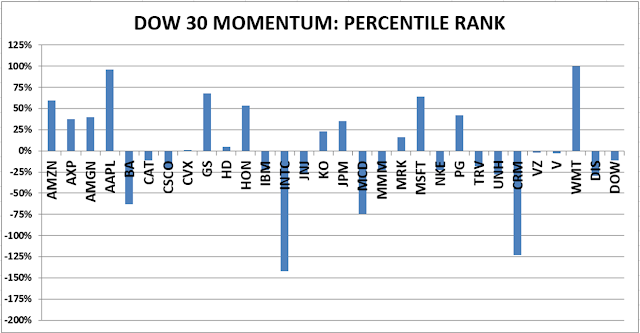
DOW STOCKS - TODAY’S MOMENTUM RANKING OF THE DOW 30 STOCKS (Ranked Daily)
 

The top ranked Stock receives 100%. The rest are then ranked based on their momentum relative to the leading Stock.
For more details, see NTSM Page at…
https://navigatethestockmarket.blogspot.com/p/a-system-for-trading-dow-30-stocks-my_8.html
 
FRIDAY MARKET INTERNALS (NYSE DATA)
My basket of Market Internals improved to BUY.
(My basket of Market Internals is a decent trend-following analysis of current market action, but should not be used alone for short term trading. They are most useful when they diverge from the Index.) 
 
 
...My current invested position is about 55% stocks, including stock mutual funds and ETFs. (I’ll need to recalculate this.) I’m usually about 50% invested in stocks, so this is a bullish, over-invested position. 75% is my max stock allocation so I have some cash now.
 
I trade about 15-20% of the total portfolio using the momentum-based analysis I provide here. When I see a definitive bottom, I add a lot more stocks to the portfolio, usually by using an S&P 500 ETF as I did back in October 2022 and 2023.

Thursday, June 27, 2024

Jobless Claims ... Durable Orders ... GDP ... Momentum Trading DOW Stocks & ETFs … Stock Market Analysis ...

 
“Trade what you see; not what you think.” – The Old Fool, Richard McCranie, trader extraordinaire.
 
“Far more money has been lost by investors in preparing for corrections, or anticipating corrections, than has been lost in the corrections themselves.” - Peter Lynch, former manager of Fidelity’s Magellan® fund.
 
“Gross Domestic Product (GDP). GDP is simply the total amount of spending in an economy. GDP, as currently measured, does not distinguish between “good” spending and “bad” spending. GDP does not distinguish between consumption spending and investment spending. GDP also does not distinguish whether spending is generated by existing wealth, by going into debt temporarily, or by going into debt permanently. In this world, every dollar spent on education or new means of production, is counted the same as every dollar spent on epic bachelor parties and video games.” – Michael Lebowitz, Real Investment Advice
 
JOBLESS CLAIMS (AP News)
“The Labor Department reported Thursday that jobless claims for the week ending June 22 fell by 6,000 to 233,000 from 239,000 the previous week. However, the total number of Americans collecting unemployment benefits rose for the eighth straight week, to 1.84 million, for the week of June 15. That’s the most since November of 2021.” Story at...
https://apnews.com/article/unemployment-benefits-jobless-claims-labor-layoffs-20f4abbd8a1821160c514cc648e4dc20
 
DURABLE ORDERS (fxstreet)
“In what was a better-than-anticipated outturn, new orders for durable goods rose 0.1% in May (chart). We were bracing for overall orders to be constrained by nondefense aircraft based on a relatively low number of orders reported by Boeing during the month. In actuality nondefense aircraft orders slipped 'only' 2.8% in May, and defense and motor vehicle orders were up, offsetting some of the weakness.” Story at..
https://www.fxstreet.com/analysis/durable-goods-orders-continue-to-showcase-weak-capex-demand-202406271407
 
GDP-FINAL (Marketplace.org)
“...The Fed particularly wants to know how GDP is changing and how much growth is slowing. The answer? Pretty substantially. GDP growth fell from 3.4% in the last quarter of 2023 to 1.4% at the beginning of this year.” Story at...
https://www.marketplace.org/2024/06/27/breaking-down-fed-chair-jay-powells-latest-gdp-report-analysis/
 
MARKET REPORT / ANALYSIS
-Thursday the S&P 500 rose about 0.1% to 5482.
-VIX declined about 2% to 12.24.
-The yield on the 10-year Treasury declined to 4.286% (compared to this time yesterday).
 
MY TRADING POSITIONS:
XLK – Holding since the October 2022 lows.
 
DWCPF - Dow Jones U.S. Completion Total Stock Market Index. – Added 12/7/2023 when I sold the S&P 500.
“The Dow Jones U.S. Completion Total Stock Market Index, also known as the DWCPF, is a widely used financial index that provides a comprehensive measure of the US equity market. The DWCPF includes all US stocks that are not included in the Dow Jones US Total Stock Market Index, which comprises large-cap and mid-cap companies. As a result, the DWCPF provides a complete picture of the US stock market, including small-cap and micro-cap companies, which are often overlooked by other indexes.” From...
https://fi.money/blog/posts/what-is-dow-jones-u-s-completion-total-stock-market-index-dwcpf
 
CURRENT SUMMARY OF APPROXIMATELY 50 INDICATORS:
The Bull/Bear Spread (Bull Indicators minus Bear Indicators) was 10 Bear-signs and 12-Bull. (The rest are neutral. It is normal to have a lot of neutral indicators since many of those are top or bottom indicators that will signal only at extremes.) The 10-dMA of spread (purple line in the chart below declined, a bearish sign.

TODAY’S COMMENT:
The Bull/Bear, 50-Indicator spread improved slightly from +1 to +2 (2 more Bull indicators than Bear indicators). This remains a Neutral indication.
 
The S&P 500 is 12.8% above the 200-dMA and that remains stretched. The bear sign is greater than 12%.
 
Market Internals continued their back-and-forth bull/bear moves. Today they were bullish, but the 10-dMA of issues advancing on the NYSE dropped below 50% (again). That’s a bearish sign that once again reminds us that breadth has been less than stellar recently.  The series of new all-time highs for the S&P 500 between 10 and 18 June were accompanied by weak 52-week all-time highs showing a narrow advance. We hope that stat will improve. If it doesn’t, it will again warn that a correction, if one were to occur, would likely be 10% or greater (based on past history).
 
LONG-TERM INDICATOR: The Long Term NTSM indicator remained HOLD: PRICE is bullish; VOLUME, VIX & SENTIMENT is neutral.
(The Long-Term Indicator is not a good top-indicator. It can signal BUY at a top.)
 
(The important major BUY in this indicator was on 21 October 2022, 7-days after the bear-market bottom. For my NTSM overall signal, I suggested that a short-term buying opportunity occurred on 27 September (based on improved market internals on the retest), although without market follow-thru, I was unwilling to call a buy; however, I did close shorts and increased stock holdings. I issued a Buy-Signal on 4 October, 6-days before the final bottom, based on stronger market action that confirmed the market internals signal. The NTSM sell-signal was issued 21 December, 9 sessions before the high of this recent bear market, based on the bearish “Friday Rundown” of indicators.)
 
BOTTOM LINE
No change: I am Neutral on the market as a whole. The trend in indicators has been down recently and price has been relatively flat. The most likely market move seems to be down, but it is not a given. All eyes are on the PCE news tomorrow.
 
ETF - MOMENTUM ANALYSIS:
TODAY’S RANKING OF 15 ETFs (Ranked Daily) ETF ranking follows:
 

The top ranked ETF receives 100%. The rest are then ranked based on their momentum relative to the leading ETF.
*For additional background on the ETF ranking system see NTSM Page at…
http://navigatethestockmarket.blogspot.com/p/exchange-traded-funds-etf-ranking.html
 
DOW STOCKS - TODAY’S MOMENTUM RANKING OF THE DOW 30 STOCKS (Ranked Daily)
 

The top ranked Stock receives 100%. The rest are then ranked based on their momentum relative to the leading Stock.
For more details, see NTSM Page at…
https://navigatethestockmarket.blogspot.com/p/a-system-for-trading-dow-30-stocks-my_8.html
 
THURSDAY MARKET INTERNALS (NYSE DATA)
My basket of Market Internals declined to SELL.
(My basket of Market Internals is a decent trend-following analysis of current market action, but should not be used alone for short term trading. They are most useful when they diverge from the Index.) 
 
 
...My current invested position is about 55% stocks, including stock mutual funds and ETFs. (I’ll need to recalculate this.) I’m usually about 50% invested in stocks, so this is a bullish, over-invested position. 75% is my max stock allocation so I have some cash now.
 
I trade about 15-20% of the total portfolio using the momentum-based analysis I provide here. When I see a definitive bottom, I add a lot more stocks to the portfolio, usually by using an S&P 500 ETF as I did back in October 2022 and 2023.
 

Wednesday, June 26, 2024

Home Sales ... Crude Inventories ... Momentum Trading DOW Stocks & ETFs … Stock Market Analysis ...

 
“Trade what you see; not what you think.” – The Old Fool, Richard McCranie, trader extraordinaire.
 
“Far more money has been lost by investors in preparing for corrections, or anticipating corrections, than has been lost in the corrections themselves.” - Peter Lynch, former manager of Fidelity’s Magellan® fund.
 
“...Development, however, requires a reliable power source, fossil fuels. Mr. Gates’s [Bill Gates, Co-founder Microsoft] support of green energy is a luxury of the rich while wood and charcoal continue to be used for cooking and heating in underdeveloped countries. This has resulted in millions of premature deaths. Abolishing fossil fuels will slow and even halt the progress of developing countries, continuing the cycle of extreme poverty and subsequent deaths.
We need a president who will stop the quixotic march toward net zero. That would be a start toward a rational conversation on the importance of fossil fuels. Mr. Gates’s support for President Biden and his green agenda will cause more harm to underdeveloped countries than any epidemic.” - Ken Dropek, WSJ Letters. From...
https://www.wsj.com/articles/want-to-help-the-world-poor-junk-net-zero-cfa5928a?mod=letterstoeditor_article_pos7
 
“We can only hope that Steven Koonin is right in predicting the demise of climate-change alarmism and its insidious war on fossil-fuel energy (“The ‘Climate Crisis’ Fades Out,” op-ed, June 11). Mr. Koonin rightly argues that “fossil fuels continue to provide about 80% of the world’s energy,” despite decades of subsidies and mandates for renewables.
Without a scalable, cost-effective energy substitute, the push to reach zero emissions by midcentury is nothing short of an economic suicide pact. When the decarbonization craze eventually fades into oblivion, it will join eugenics, the population-bomb fears, and the Y2K hysteria in the trash bin of junk-science history.” - John DiChiara, WSJ Letters. From...
https://www.wsj.com/articles/the-junk-science-of-the-climate-crisis-craze-power-5d40e3ed?mod=letterstoeditor_article_pos2
 
NEW HOME SALES / BUILDING PERMITS (CNN)
“New home sales, which make up only about 10% of the market, fell 11.3% in May from the prior month, to 619,000, according to government data released Wednesday. That was the steepest monthly decline since September 2022 and marks the lowest level since November... Building permits, seen as a bellwether of future construction, dipped 3.8%.” Story at...
https://www.cnn.com/2024/06/26/economy/us-new-home-sales-may/index.html
 
EIA CRUDE INVENTORIES (EIA)
“U.S. commercial crude oil inventories (excluding those in the Strategic Petroleum Reserve) increased by 3.6 million barrels from the previous week. At 460.7 million barrels, U.S. crude oil inventories are about 2% below the five year average for this time of year.” Report at...
https://ir.eia.gov/wpsr/wpsrsummary.pdf
 
MARKET REPORT / ANALYSIS
-Wednesday the S&P 500 rose about 0.2% to 5478.
-VIX declined about 2% to 12.54.
-The yield on the 10-year Treasury rose to 4.329% (compared to this time yesterday).
 
MY TRADING POSITIONS:
UWM – Added 5/2/2024; SOLD 6/25/2024
QLD – Added 4/29/2024; SOLD 6/25/2024
XLK – Holding since the October 2022 lows.
 
DWCPF - Dow Jones U.S. Completion Total Stock Market Index. – Added 12/7/2023 when I sold the S&P 500.
“The Dow Jones U.S. Completion Total Stock Market Index, also known as the DWCPF, is a widely used financial index that provides a comprehensive measure of the US equity market. The DWCPF includes all US stocks that are not included in the Dow Jones US Total Stock Market Index, which comprises large-cap and mid-cap companies. As a result, the DWCPF provides a complete picture of the US stock market, including small-cap and micro-cap companies, which are often overlooked by other indexes.” From...
https://fi.money/blog/posts/what-is-dow-jones-u-s-completion-total-stock-market-index-dwcpf
 
CURRENT SUMMARY OF APPROXIMATELY 50 INDICATORS:
The Bull/Bear Spread (Bull Indicators minus Bear Indicators) was 11 Bear-signs and 12-Bull. (The rest are neutral. It is normal to have a lot of neutral indicators since many of those are top or bottom indicators that will signal only at extremes.) The 10-dMA of spread (purple line in the chart below) remained flat and that doesn’t change the apparent rollover that started a few sessions ago.

TODAY’S COMMENT:
The Bull/Bear, 50-Indicator spread improved slightly from -3 to +1 (1 more Bull indicator than Bear indicators). This remains a Neutral indication.
 
The S&P 500 is 12.8% above the 200-dMA and that remains stretched. The bear sign is greater than 12%.
 
On a more positive note, RSI returned to neutral after 5 days signaling overbought; the 10-dMA of issues advancing on the NYSE moved above 50% today, indicating that more than half of the issues have been advancing over the last 2-weeks; my Money Trend indicator is bullish.
 
I sold leveraged positions and half my Tech ETF (XLK) yesterday. I won’t reset those positions until we see a clear sign of trend based on indicators. I suspect the markets will retreat to the lower trend line, around the 50-dMA at 5250. I am not confident in that prediction because we have seen a narrow advance suggesting a 10% decline.  It will be obviously important to see broadening of markets so maybe we can set aside those larger correction worries.  
 
LONG-TERM INDICATOR: The Long Term NTSM indicator remained HOLD: PRICE is bullish; VOLUME, VIX & SENTIMENT is neutral.
(The Long-Term Indicator is not a good top-indicator. It can signal BUY at a top.)
 
(The important major BUY in this indicator was on 21 October 2022, 7-days after the bear-market bottom. For my NTSM overall signal, I suggested that a short-term buying opportunity occurred on 27 September (based on improved market internals on the retest), although without market follow-thru, I was unwilling to call a buy; however, I did close shorts and increased stock holdings. I issued a Buy-Signal on 4 October, 6-days before the final bottom, based on stronger market action that confirmed the market internals signal. The NTSM sell-signal was issued 21 December, 9 sessions before the high of this recent bear market, based on the bearish “Friday Rundown” of indicators.)
 
BOTTOM LINE
I am Neutral on the market as a whole. The trend in indicators has been down recently and price has been relatively flat. The most likely market move seems to be down, but it is not a given.
 
ETF - MOMENTUM ANALYSIS:
TODAY’S RANKING OF 15 ETFs (Ranked Daily) ETF ranking follows:
 

The top ranked ETF receives 100%. The rest are then ranked based on their momentum relative to the leading ETF.
*For additional background on the ETF ranking system see NTSM Page at…
http://navigatethestockmarket.blogspot.com/p/exchange-traded-funds-etf-ranking.html
 
DOW STOCKS - TODAY’S MOMENTUM RANKING OF THE DOW 30 STOCKS (Ranked Daily)
 

The top ranked Stock receives 100%. The rest are then ranked based on their momentum relative to the leading Stock.
For more details, see NTSM Page at…
https://navigatethestockmarket.blogspot.com/p/a-system-for-trading-dow-30-stocks-my_8.html
 
WEDNESDAY MARKET INTERNALS (NYSE DATA)
My basket of Market Internals remained HOLD.
(My basket of Market Internals is a decent trend-following analysis of current market action, but should not be used alone for short term trading. They are most useful when they diverge from the Index.) 
 
 
...My current invested position is about 55% stocks, including stock mutual funds and ETFs. (I’ll need to recalculate this.) I’m usually about 50% invested in stocks, so this is a bullish, over-invested position. 75% is my max stock allocation so I have some cash now.
 
I trade about 15-20% of the total portfolio using the momentum-based analysis I provide here. When I see a definitive bottom, I add a lot more stocks to the portfolio, usually by using an S&P 500 ETF as I did back in October 2022 and 2023.

Tuesday, June 25, 2024

Consumer Confidence ... Momentum Trading DOW Stocks & ETFs … Stock Market Analysis

 
“Trade what you see; not what you think.” – The Old Fool, Richard McCranie, trader extraordinaire.
 
“Far more money has been lost by investors in preparing for corrections, or anticipating corrections, than has been lost in the corrections themselves.” - Peter Lynch, former manager of Fidelity’s Magellan® fund.
 

Political commentary from Michael Ramirez at...
https://michaelpramirez.com/index.html
 
“One of the more interesting aspects of the stolen-election conspiracy theory revolves around the number of write-in votes that heavily favored one candidate (“A Belated Apology for ‘2000 Mules’,” Review & Outlook, June 6). Common sense would suggest that if the campaign for Candidate A encourages their voters to vote early via mail-in ballots and Candidate B discourages his voters from voting via mail-in ballots, a majority of mail-in ballots will likely be for Candidate A. It also follows that if more supporters of Candidate A vote early, then a lesser percentage of those voters are casting their vote on Election Day. It would not be unusual then for Candidate B to have an early lead only to lose as the mail-in ballots are counted. But why let logic get in the way of a good conspiracy theory?” - Fred Rothzeid, WSJ Letters. From...
https://www.wsj.com/articles/can-logic-disrupt-the-stolen-election-conspiracy-theory-votes-d02f0c4b?mod=letterstoeditor_article_pos9
 
“A Republican-led effort to block one of President Joe Biden's student loan debt relief programs in court has succeeded just days before it was set to go into effect. Decisions by U.S. District Judges John Ross in Missouri and Daniel Crabtree in Kansas, both appointees of former President Barack Obama, on Monday sided with GOP state attorneys general in thwarting Biden's Saving on a Valuable Education (SAVE) plan, according to Reuters. The SAVE plan, which was set to go into effect on July 1, was initially announced by Biden in 2022 alongside a since-canceled larger plan that would have erased up to $20,000 in student loan debt for tens of millions of borrowers.” - Newsweek. Story at...
Biden Stung by Student Loan Legal Loss Days Before Taking Effect (msn.com)
My cmt: We did point out that this plan was blatantly unconstitutional. 

CONSUMER CONFIDENCE (Conference board)
“Confidence pulled back in June but remained within the same narrow range that’s held throughout the past two years, as strength in current labor market views continued to outweigh concerns about the future. However, if material weaknesses in the labor market appear, Confidence could weaken as the year progresses,” said Dana M. Peterson, Chief Economist at The Conference Board.” Press release at...
https://www.conference-board.org/topics/consumer-confidence
 
MARKET REPORT / ANALYSIS
-Tuesday the S&P 500 rose about 0.4% to 5469.
-VIX declined about 3% to 13.33.
-The yield on the 10-year Treasury rose to 4.242% (compared to this time yesterday).
 
MY TRADING POSITIONS:
UWM – Added 5/2/2024; SOLD 6/25/2024
QLD – Added 4/29/2024; SOLD 6/25/2024
XLK – Holding since the October 2022 lows.
 
DWCPF - Dow Jones U.S. Completion Total Stock Market Index. – Added 12/7/2023 when I sold the S&P 500.
“The Dow Jones U.S. Completion Total Stock Market Index, also known as the DWCPF, is a widely used financial index that provides a comprehensive measure of the US equity market. The DWCPF includes all US stocks that are not included in the Dow Jones US Total Stock Market Index, which comprises large-cap and mid-cap companies. As a result, the DWCPF provides a complete picture of the US stock market, including small-cap and micro-cap companies, which are often overlooked by other indexes.” From...
https://fi.money/blog/posts/what-is-dow-jones-u-s-completion-total-stock-market-index-dwcpf
 
CURRENT SUMMARY OF APPROXIMATELY 50 INDICATORS:
The Bull/Bear Spread (Bull Indicators minus Bear Indicators) reversed to 14 Bear-signs and 11-Bull. (The rest are neutral. It is normal to have a lot of neutral indicators since many of those are top or bottom indicators that will signal only at extremes.) The 10-dMA of spread (purple line in the chart below) turned lower today – a bearish sign that appears to continue the rollover started a few sessions ago.

TODAY’S COMMENT:
Yesterday there was another Bearish outside reversal day. There was another one just 4 sessions ago and that is the third one in 2-weeks.
-According to Investopedia: “This demonstrates that the bulls had control over the market before the bears took the reins in a meaningful way, signaling a shift in the overall trend... For instance, a stock may have a small move higher on the first day, climb even higher the second day, but then sharply decline by the second day’s end... This formation is considered a strong indicator that the prior upward momentum is waning and a reversal is on the horizon.”
https://www.investopedia.com/terms/o/outsidereversal.asp#:~:text=A%20bearish%20outside%20reversal%2C%20also,by%20the%20second%20day's%20end
My analysis looks only at the S&P 500, so parts of the market may defy the signal and, of course, these signals are not always correct. Still, the Bull/Bear, 50-Indicator spread reversed from +10 to -3 (10 more Bull indicators than Bear indicators). This is a Bearish reversal, although overall, I’ll call it a Neutral indication.
 
The S&P 500 is 12.7% above the 200-dMA and that remains stretched. The bear sign is greater than 12%.
 
LONG-TERM INDICATOR: The Long Term NTSM indicator remained HOLD: PRICE is bullish; VOLUME, VIX & SENTIMENT is neutral.
(The Long-Term Indicator is not a good top-indicator. It can signal BUY at a top.)
 
(The important major BUY in this indicator was on 21 October 2022, 7-days after the bear-market bottom. For my NTSM overall signal, I suggested that a short-term buying opportunity occurred on 27 September (based on improved market internals on the retest), although without market follow-thru, I was unwilling to call a buy; however, I did close shorts and increased stock holdings. I issued a Buy-Signal on 4 October, 6-days before the final bottom, based on stronger market action that confirmed the market internals signal. The NTSM sell-signal was issued 21 December, 9 sessions before the high of this recent bear market, based on the bearish “Friday Rundown” of indicators.)
 
BOTTOM LINE
I took profits in QLD, UWM and half of my XLK position. I didn’t like the reversal in indicators today and I wanted to limit losses if the markets should turn down. Leveraged positions lose money twice as fast when markets turn down. I am not too bearish, I just don’t want to hold leveraged positions unless I am fairly sure the market direction is up.
 
I am Neutral on the market as a whole.
 
ETF - MOMENTUM ANALYSIS:
TODAY’S RANKING OF 15 ETFs (Ranked Daily) ETF ranking follows:
 
The top ranked ETF receives 100%. The rest are then ranked based on their momentum relative to the leading ETF.
*For additional background on the ETF ranking system see NTSM Page at…
http://navigatethestockmarket.blogspot.com/p/exchange-traded-funds-etf-ranking.html
 
DOW STOCKS - TODAY’S MOMENTUM RANKING OF THE DOW 30 STOCKS (Ranked Daily)
 
The top ranked Stock receives 100%. The rest are then ranked based on their momentum relative to the leading Stock.
For more details, see NTSM Page at…
https://navigatethestockmarket.blogspot.com/p/a-system-for-trading-dow-30-stocks-my_8.html
 
TUESDAY MARKET INTERNALS (NYSE DATA)
My basket of Market Internals declined to HOLD. (My basket of Market Internals is a decent trend-following analysis of current market action, but should not be used alone for short term trading. They are most useful when they diverge from the Index.) 
 
 
...My current invested position is about 55% stocks, including stock mutual funds and ETFs. (I’ll need to recalculate this.) I’m usually about 50% invested in stocks, so this is a bullish, over-invested position. 75% is my max stock allocation so I have some cash now.
 
I trade about 15-20% of the total portfolio using the momentum-based analysis I provide here. When I see a definitive bottom, I add a lot more stocks to the portfolio, usually by using an S&P 500 ETF as I did back in October 2022 and 2023.
 

SOLD SOME STOCK ETFs

I sold leveraged positions in QLD and UWM and half of my position in XLK. Indicators turned back to neutral today and I don't want to take chances with leveraged positions. 

I had an 80% gain in XLK; cutting my position by half rebalances my tech position. I am still over weighted in tech - I don't want to be ridiculously overweight tech now. 

Monday, June 24, 2024

... Momentum Trading DOW Stocks & ETFs … Stock Market Analysis ...

“Trade what you see; not what you think.” – The Old Fool, Richard McCranie, trader extraordinaire.
 
“Far more money has been lost by investors in preparing for corrections, or anticipating corrections, than has been lost in the corrections themselves.” - Peter Lynch, former manager of Fidelity’s Magellan® fund.
 
“A remarkable 2 billion tons of rare Earth minerals have reportedly been unearthed at a mining site in the United States. This discovery can potentially disrupt China’s control over the industry, leading to a significant shift in the global rare Earth minerals market, with the US coming out on top.” From...
Wyoming Strikes 2.34 Billion Tons of Rare Minerals, Leaving China Rattled (msn.com)
 
"'In the Democratic Party, not everybody gets their way, but everybody gets a voice. In the Republican Party, there's just one voice.”- Christopher Gibbs, Farmer, Shelby County Ohio.
 
“The latest Fox News poll is TRASH! They used a biased, Democrat-leaning sample of voters, polling more Biden 2020 voters than Trump 2020 voters to skew the results in favor of Crooked Joe. I am leading BIG in virtually every other poll, including in all of the key battleground states.” – Donald Trump.
My cmt: The lady doth protest too much, methinks.
 
WILL DEBT SINK THE AMERICAN EMPIRE? (WSJ)
“In the presidential race, there’s not much partisan difference or advantage on this subject. Donald Trump and President Biden have overseen similar additions to the nation’s accumulated debt—in the range of $7 trillion in each case—during their terms. The national response to both has been, by and large, to look the other way. History, however, offers some cautionary notes about the consequences of swimming in debt. Over the centuries and across the globe, nations and empires that blithely piled up debt have, sooner or later, met unhappy ends.
 
Historian Niall Ferguson recently invoked what he calls his own personal law of history: “Any great power that spends more on debt service (interest payments on the national debt) than on defense will not stay great for very long. True of Habsburg Spain, true of ancien rĂ©gime France, true of the Ottoman Empire, true of the British Empire, this law is about to be put to the test by the U.S. beginning this very year.” Story at...
https://www.wsj.com/politics/policy/will-debt-sink-the-american-empire-8459096b
 
MARKET REPORT / ANALYSIS
-Monday the S&P 500 declined about 0.3% to 5448.
-VIX rose about 1% to 13.33.
-The yield on the 10-year Treasury declined to 4.234%.
 
MY TRADING POSITIONS:
UWM – Added 5/2/2024
QLD – Added 4/29/2024
XLK – Holding since the October 2022 lows.
 
DWCPF - Dow Jones U.S. Completion Total Stock Market Index. – Added 12/7/2023 when I sold the S&P 500.
“The Dow Jones U.S. Completion Total Stock Market Index, also known as the DWCPF, is a widely used financial index that provides a comprehensive measure of the US equity market. The DWCPF includes all US stocks that are not included in the Dow Jones US Total Stock Market Index, which comprises large-cap and mid-cap companies. As a result, the DWCPF provides a complete picture of the US stock market, including small-cap and micro-cap companies, which are often overlooked by other indexes.” From...
https://fi.money/blog/posts/what-is-dow-jones-u-s-completion-total-stock-market-index-dwcpf
 
CURRENT SUMMARY OF APPROXIMATELY 50 INDICATORS:
The Bull/Bear Spread (Bull Indicators minus Bear Indicators) remained 7 Bear-signs and 17-Bull. (The rest are neutral. It is normal to have a lot of neutral indicators since many of those are top or bottom indicators that will signal only at extremes.) The 10-dMA of spread (purple line in the chart below) bounced higher today – a bullish sign.

TODAY’S COMMENT:
The Bull/Bear, 50-Indicator spread jumped from -2 to +10 (10 more Bull indicators than Bear indicators). This is a nice Bullish reversal. Internals improved too.
 
For the day, 72% of volume on the NYSE was up-volume; advancing issues outpaced declining issues 2 to 1; advancing volume was nearly 3x declining volume; and there were 3x as many new, 52-week highs as new-lows. Those are solid numbers and I would have guessed that the S&P 500 would have been higher – I would have been wrong on that guess. The Index refused to go along, but I would expect it to be higher tomorrow.
 
The S&P 500 is 12.4% above the 200-dMA and that remains stretched. The bear sign is greater than 12%.
 
LONG-TERM INDICATOR: The Long Term NTSM indicator remained HOLD: PRICE is bullish; VOLUME, VIX & SENTIMENT is neutral.
(The Long-Term Indicator is not a good top-indicator. It can signal BUY at a top.)
 
(The important major BUY in this indicator was on 21 October 2022, 7-days after the bear-market bottom. For my NTSM overall signal, I suggested that a short-term buying opportunity occurred on 27 September (based on improved market internals on the retest), although without market follow-thru, I was unwilling to call a buy; however, I did close shorts and increased stock holdings. I issued a Buy-Signal on 4 October, 6-days before the final bottom, based on stronger market action that confirmed the market internals signal. The NTSM sell-signal was issued 21 December, 9 sessions before the high of this recent bear market, based on the bearish “Friday Rundown” of indicators.)
 
BOTTOM LINE
I am cautiously bullish, but if market action is weak again tomorrow (especially tech), I will sell QLD and possibly some of my XLK position.
 
ETF - MOMENTUM ANALYSIS:
TODAY’S RANKING OF 15 ETFs (Ranked Daily) ETF ranking follows:
 

The top ranked ETF receives 100%. The rest are then ranked based on their momentum relative to the leading ETF.
*For additional background on the ETF ranking system see NTSM Page at…
http://navigatethestockmarket.blogspot.com/p/exchange-traded-funds-etf-ranking.html

DOW STOCKS - TODAY’S MOMENTUM RANKING OF THE DOW 30 STOCKS (Ranked Daily)
 

The top ranked Stock receives 100%. The rest are then ranked based on their momentum relative to the leading Stock.
For more details, see NTSM Page at…
https://navigatethestockmarket.blogspot.com/p/a-system-for-trading-dow-30-stocks-my_8.html

MONDAY MARKET INTERNALS (NYSE DATA)
My basket of Market Internals Improved to BUY.
(My basket of Market Internals is a decent trend-following analysis of current market action, but should not be used alone for short term trading. They are most useful when they diverge from the Index.) 
 
 
...My current invested position is about 65% stocks, including stock mutual funds and ETFs. I’m usually about 50% invested in stocks, so this is a bullish, over-invested position. 75% is my max stock allocation so I have some cash now.
 
I trade about 15-20% of the total portfolio using the momentum-based analysis I provide here. When I see a definitive bottom, I add a lot more stocks to the portfolio, usually by using an S&P 500 ETF as I did back in October 2022 and 2023.

Holding On

Internals and indicators turned sharply to the Bullish side today. Several Breadth indicators improved. I am going to hang on to leveraged positions for the time being. 
Technology, (XLK-ETF) got a little ahead of itself and was above its upper trend line. It has now retreated back to the upper trend lune.  It could retreat more, but I don't think this is anything more than a routine correction in tech. I could be wrong. We'll see.

Friday, June 21, 2024

Existing Home Sales ... Nikki Haley for VP ... Momentum Trading DOW Stocks & ETFs … Stock Market Analysis ...

 
“Trade what you see; not what you think.” – The Old Fool, Richard McCranie, trader extraordinaire.
 
“Far more money has been lost by investors in preparing for corrections, or anticipating corrections, than has been lost in the corrections themselves.” - Peter Lynch, former manager of Fidelity’s Magellan® fund.
 
BIDEN AMNESTY ILLEGAL (Newsweek via msn.com)
“Biden's amnesty [mass amnesty for an estimated half million illegal aliens now married to U.S. citizens and who have lived in the U.S. for a decade or more] is blatantly, flagrantly, and offensively unconstitutional. [According to the Constitution] Only Congress, not the president, can "establish a uniform rule of naturalization." Prosecutorial discretion, which Biden (like Obama before him) laughably invokes, is only legitimate when applied on an individualized, case-by-case basis. Prosecutorial discretion does not apply to a blanket refusal to enforce large swaths of immigration law—an act which itself violates the president's Article II, Sec. 3 prerogative to "take care that the laws be faithfully executed." The president has plenary statutory authority under 8 U.S.C. Sec. 1201 to deport any alien (legal or illegal) at any time for any reason, but he does not have any reciprocal power to naturalize aliens outside of Congress.” Story at...
Joe Biden's Executive Amnesty Is Illegal, Unjust, and Self-Defeating | Opinion (msn.com)
My cmt: While the Democrats explicitly campaign on “restoring and strengthening our Democracy” (while implying Trump will destroy Democracy), Biden is again blatantly violating the Constitution, the very basis for our representative Democracy.
 
NIKKI HALEY THE CLEAR CHOICE FOR TRUMP’S VP (USA Today via msn.com)
“I believe that Trump’s best choice is to pick somebody who can make voting for him more palatable. Moderates who dislike President Joe Biden but are turned off by the Trump persona could be a deciding force in the election. ...Haley, as the vice president pick, would give Trump the best path forward. A Trump-Haley ticket would represent an olive branch extended between the two factions of the GOP at war with each other. Trump’s populist base would certainly take issue with it, but his supporters won't let any VP choice stand in the way of their vote for him.” Opinion at... 
Nikki Haley is the clear choice for Trump's VP pick. So I'm sure he'll go full MAGA. (msn.com)
My cmt: I couldn’t agree more, but Trump is too arrogant to think strategically, and further, he wants a MAGA “Yes Man.”
 
EXISTING HOME SALES (NAR)
“-Existing-home sales slipped 0.7% in May to a seasonally adjusted annual rate of 4.11 million. Sales descended 2.8% from one year ago.
-The median existing-home sales price jumped 5.8% from May 2023 to $419,300 – the highest price ever recorded and the eleventh consecutive month of year-over-year price gains.
-The inventory of unsold existing homes grew 6.7% from the previous month to 1.28 million at the end of May, or the equivalent of 3.7 months' supply at the current monthly sales pace...
... Eventually, more inventory will help boost home sales and tame home price gains in the upcoming months," said NAR Chief Economist Lawrence Yun.” Press release at...
https://www.nar.realtor/newsroom/existing-home-sales-edged-lower-by-0-7-in-may-as-median-sales-price-reached-record-high-of-419300
 
MARKET REPORT / ANALYSIS
-Friday the S&P 500 declined about 0.2% to 5465.
-VIX rose about 1% to 13.20.
-The yield on the 10-year Treasury declined to 4.257%.
 
MY TRADING POSITIONS:
UWM – Added 5/2/2024
QLD – Added 4/29/2024
XLK – Holding since the October 2022 lows.
 
DWCPF - Dow Jones U.S. Completion Total Stock Market Index. – Added 12/7/2023 when I sold the S&P 500.
“The Dow Jones U.S. Completion Total Stock Market Index, also known as the DWCPF, is a widely used financial index that provides a comprehensive measure of the US equity market. The DWCPF includes all US stocks that are not included in the Dow Jones US Total Stock Market Index, which comprises large-cap and mid-cap companies. As a result, the DWCPF provides a complete picture of the US stock market, including small-cap and micro-cap companies, which are often overlooked by other indexes.” From...
https://fi.money/blog/posts/what-is-dow-jones-u-s-completion-total-stock-market-index-dwcpf
 
CURRENT SUMMARY OF APPROXIMATELY 50 INDICATORS:
The Bull/Bear Spread (Bull Indicators minus Bear Indicators) remained 13 Bear-signs and 11-Bull. (The rest are neutral. It is normal to have a lot of neutral indicators since many of those are top or bottom indicators that will signal only at extremes.) The 10-dMA of spread (purple line in the chart below) started falling Friday – that’s a concern.

TODAY’S COMMENT:
The S&P 500 is in the center of the channel when we draw channel lines back to October (black dashed lines in the above chart). However, the S&P 500 is at the top of the channel extending back to July (red dashed line above) so that could be a sign that a retreat is due. I don’t know which alternative carries more weight; I’ve never been much of a chart guy. Let’s just say caution is warranted.  
 
Friday was “Triple Witching” as stock options, futures, and Index options all expired.  Volumes were much higher than normal. Market action can sometimes be odd on Triple Witching days, but today, price-action was subdued.
 
Final numbers showed high, unchanged-volume on Thursday and again on Friday (even after adjusting for the high volume associated with options expiration). As I’ve often said, many believe that this indicator suggests investor confusion at market turning points. The trend has been up so I would interpret this signal as predicting a turn down. Still, “High-unchanged-volume” is not one of my indicators because it is often wrong.  
 
The Bull/Bear, 50-Indicator spread is -2 (2 more Bear indicator than Bull indicators). This is a Neutral to Bearish indication, but since the 10-dMA of the 50 indicators is falling, let’s call it bearish.
 
Some additional Bearish indicators are: S&P 500 is 13.2% above the 200-dMA (The bear sign is greater than 12%.); the S&P 500 is too far ahead of breadth; there was a bearish outside reversal yesterday; my Money Trend indicator is falling; both short-term and long-term NewHi/NewLow indicators are bearish; RSI is overbought; and there are other bear signs.
 
While indicators have declined, there are some indicators that are improving or at least holding their own. The 10-dMA of issues advancing on the NYSE is still below 50%, indicating that for the last 2-weeks, less than half of all issues on the NYSE have been up. The good news is that the 50 and 100-dMA of issues advancing on the NYSE are both above 50% and my Breadth MACD indicator made a bullish cross today. Another breadth indicator, the McClellan Oscillator, is still in bearish territory, but it has been improving too. These breadth indicators confuse the issue and suggest that a correction may not be imminent. Top indicators agree.
 
My Top-indicators have not yet warned of a top, but they are close.  A big move higher (say greater than 1%) would probably suggest a top. So far indicators have suggested that a decline now might be in the 10% or less range due to the narrow advance.
 
LONG-TERM INDICATOR: The Long Term NTSM indicator remained HOLD: PRICE is bullish; VOLUME, VIX & SENTIMENT is neutral.
(The Long-Term Indicator is not a good top-indicator. It can signal BUY at a top.)
 
(The important major BUY in this indicator was on 21 October 2022, 7-days after the bear-market bottom. For my NTSM overall signal, I suggested that a short-term buying opportunity occurred on 27 September (based on improved market internals on the retest), although without market follow-thru, I was unwilling to call a buy; however, I did close shorts and increased stock holdings. I issued a Buy-Signal on 4 October, 6-days before the final bottom, based on stronger market action that confirmed the market internals signal. The NTSM sell-signal was issued 21 December, 9 sessions before the high of this recent bear market, based on the bearish “Friday Rundown” of indicators.)
 
BOTTOM LINE
Markets are stretched and breadth is looking weak. A 10% retreat is possible, although we don’t have a sell signal at this point. I will take profits in leveraged positions (QLD and UWM) Monday, since markets are looking weak. Let’s see what happens Monday.
 
ETF - MOMENTUM ANALYSIS:
TODAY’S RANKING OF 15 ETFs (Ranked Daily) ETF ranking follows:
 

The top ranked ETF receives 100%. The rest are then ranked based on their momentum relative to the leading ETF.
*For additional background on the ETF ranking system see NTSM Page at…
http://navigatethestockmarket.blogspot.com/p/exchange-traded-funds-etf-ranking.html
 
DOW STOCKS - TODAY’S MOMENTUM RANKING OF THE DOW 30 STOCKS (Ranked Daily)
 

The top ranked Stock receives 100%. The rest are then ranked based on their momentum relative to the leading Stock.
For more details, see NTSM Page at…
https://navigatethestockmarket.blogspot.com/p/a-system-for-trading-dow-30-stocks-my_8.html
 
FRIDAY MARKET INTERNALS (NYSE DATA)
My basket of Market Internals remained HOLD.
(My basket of Market Internals is a decent trend-following analysis of current market action, but should not be used alone for short term trading. They are most useful when they diverge from the Index.) 
 
 
...My current invested position is about 65% stocks, including stock mutual funds and ETFs. I’m usually about 50% invested in stocks, so this is a bullish, over-invested position. 75% is my max stock allocation so I have some cash now.
 
I trade about 15-20% of the total portfolio using the momentum-based analysis I provide here. When I see a definitive bottom, I add a lot more stocks to the portfolio, usually by using an S&P 500 ETF as I did back in October 2022 and 2023.