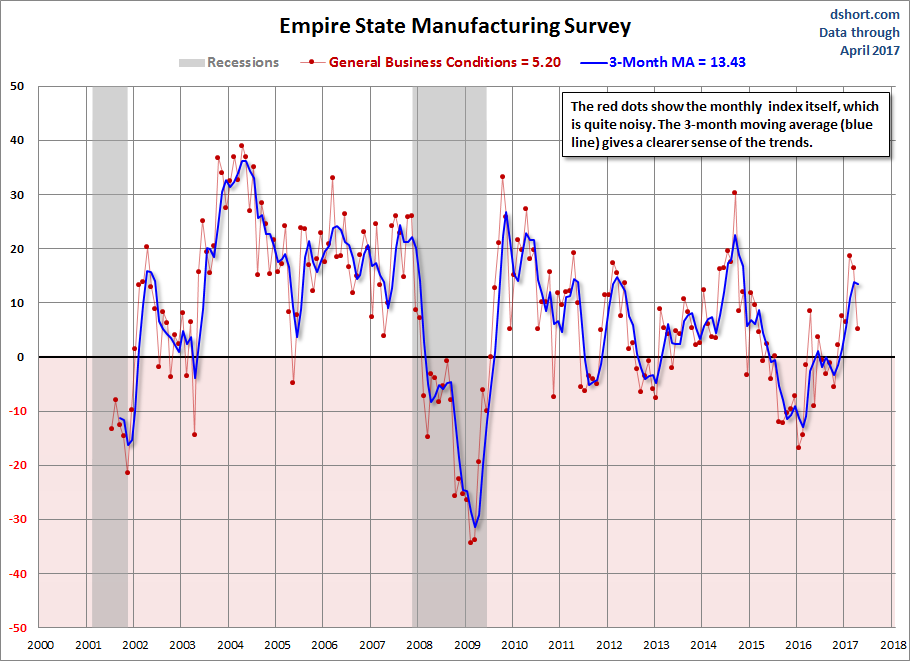
A gauge of New York area manufacturing slowed
considerably in April, possibly a sign that the euphoria of the business
community after the election of President Donald Trump is beginning to wear
off. The Empire State manufacturing survey fell to a reading of 5.2 in April
from a two-year high of 16.4 in March…” Story at…
 Chart from Advisor Perspectives at…
See Advisor Perspectives for additional commentary and
analysis.
My cmt: There’s a lot of volatility ion this data so it’s
hard to make any conclusion here other than to note that manufacturing
expectations remain in expansion.
MARKET REPORT / ANALYSIS
-Monday the S&P 500 rose about 0.9% to 2349.
-VIX dropped about 8% to 14.66 at the close.
-The yield on the 10-year Treasury rose to 2.247%.
As I have noted on many times, applying correction
techniques on small down moves is always “iffy”. The drop Friday on higher volume would be
considered a “sell”, but to many this is just a “buy-the-dip” opportunity. So we are left with unknowns.
The Bear Case:
-Monday was a Statistically significant up-day and that’s
actually bearish, especially following the Statistically significant down-day
Friday.
-There was Late-day buying today, but on a smoothed
20-day basis late-day selling has been the trend. Late day volume dropped a lot
today so it’s hard to be too optimistic about today’s late surge.
-The S&P 500 closed below its 50-dMA for the 3rd-consecutive
day.
-The close today was below the lower trend line and on
the red downtrend line shown below. We need a close above the red line to feel
more bullish…

-Up-volume is falling.
-My “calm-before-the-storm” indicator again flashed sell.
It is based on statistical analysis and identifies calm markets that often lead
to significant down moves. (This indicator caused me a lot of grief earlier
this year when it gave a false signal in early January that persisted thru all
of February.) Even so, it is usually correct.
-Money Trend is falling.
-My Sum of 16-Indicators improved slightly from -9 to -7
but it remains negative and on a smoothed basis it was down on the day.
-Declining new highs. New highs are shown in Red with a
smoothed value in Green.

On the Bull Side:
-The Index is very close to its lower trend line so the
dip buyers could be right.
-On a 10-day basis the % of advancing stocks improved
from 50.2 to 51.7%.
Overall I am still somewhat (cautiously) bearish. If the
market is up for a day or two we’ll have to reconsider.
CURRENT RANKING OF 15 ETFs (Ranked Daily)
 The top ranked ETF receives 100%. The rest are then
ranked based on their momentum relative to the leading ETF. While momentum isn’t stock performance per
se, momentum is closely related to stock performance. For example, over the 4-months
from Oct thru mid-February 2016, the number 1 ranked Financials (XLF) outperformed
the S&P 500 by nearly 20%.
The top ranked ETF receives 100%. The rest are then
ranked based on their momentum relative to the leading ETF. While momentum isn’t stock performance per
se, momentum is closely related to stock performance. For example, over the 4-months
from Oct thru mid-February 2016, the number 1 ranked Financials (XLF) outperformed
the S&P 500 by nearly 20%.
*For additional background on the ETF ranking system see
NTSM Page at…
I would avoid iEFA and XLE their 120-dMAs are now
trending down. Financials did well today on the rise in interest rates. If there is no correction, interest rates should
rise and XLF should continue to improve.
In my back testing it was apparent that during
corrections flight to safety meant that XLU tended to outperform. Rather than try to chase the hottest ETF, I
suggest exiting ETF trading positions, or just remaining with the recent
recommendations (XLK) for long-term investors.
The fact that XLU is outperforming everything is an
indication that the Pros are positioning for a correction.
1. Utilities Select Sector SPDR ETF (XLU) remains the top
ranked ETF.
(I am holding XLK.)
SHORT-TERM TRADING PORTFOLIO - 2017 (Small-% of the
total portfolio)
Rydex Inverse 2x Nasdaq 100. Established 4/13/2017.
VXX. Established 4/13/2017.
This pullback could
be over already so these positions will not be held long if the market moves
higher.
MONDAY MARKET INTERNALS (NYSE DATA)
Market Internals switched
to Neutral on the market.

Market Internals are a decent trend-following analysis of
current market action, but should not be used alone for short term trading.
They are usually right, but they are often late. They are most useful when they diverge from
the Index. In 2014, using these
internals alone would have made a 9% return vs. 13% for the S&P 500 (in on
Positive, out on Negative – no shorting).
LONG TERM INDICATOR
Monday, Sentiment, Price, Volume & VIX indicators
were neutral.

MY INVESTED STOCK POSITION:
TSP (RETIREMENT ACCOUNT – GOV EMPLOYEES) ALLOCATION
I increased
stock allocation to 50% stocks in the S&P 500 Index fund (C-Fund) Friday, 24
March 2017 in my long-term accounts, based on short-term indicators.
Remainder is 50% G-Fund (Government securities). This is a conservative retiree
allocation based mostly on low volume at the test of the 50-dMA.